OPEN-SOURCE SCRIPT
Aggiornato Order Block plus
Indicator Description: “Order Block Plus”
This indicator is designed for traders who aim to identify the strength and position of supply and demand zones on the chart and receive key signals for entry or exit. Below is a detailed explanation of its functionality:
Features and Applications:
1. Identifying Supply and Demand Zones:
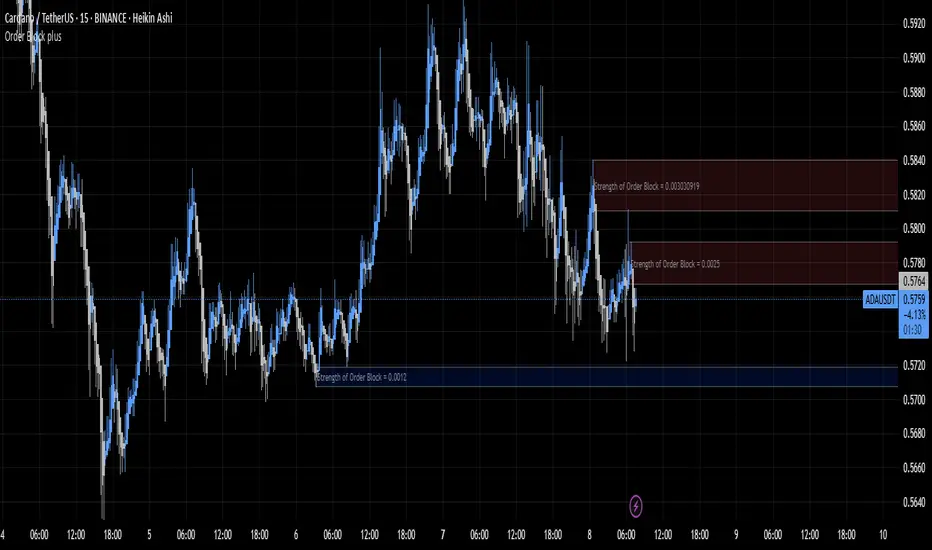
• Supply (Resistance) and Demand (Support) zones are visually displayed on the chart.
• Each zone is marked with a specific color (Yellow for supply, Blue for demand) for easy identification.
2. Breakout and Reversal Signals:
• The indicator detects Breakout and Reversal patterns and highlights them with alerts.
• Example: Detecting price breaking above or below key levels.
3. Candlestick Pattern Support:
• Identifies powerful patterns such as Bullish Engulf, Bearish Engulf, Three White Soldiers, and Three Black Crows.
4. Displaying Zone Strength:
• The indicator shows the strength of supply and demand zones using text displayed inside each zone.
5. Alerts:
• Provides alerts for zone breakouts, breakdowns, and new zone formations.
• Example: Alerts for breaking a demand or supply zone.
How to Use:
1. Adding to the Chart:
• The indicator can be applied to any time frame and is suitable for Forex, stocks, or cryptocurrency charts.
2. Identifying Trading Opportunities:
• Demand zones indicate strong support levels where prices are likely to rise.
• Supply zones indicate resistance levels where prices are likely to fall.
3. Examining Zone Strength:
• The strength of each zone is displayed with text inside the zone.
Indicator Settings:
• Zone Colors:
• The default colors for supply and demand zones are yellow and blue, but they can be customized.
• Alerts:
• Configurable alerts for breakouts or reversals.
Advantages:
• Automatic detection of key price levels.
• Accurate and timely alerts for trades.
• Customizable for professional traders.
Note: This indicator is designed for technical analysis and should be used alongside a suitable trading strategy.
This indicator is designed for traders who aim to identify the strength and position of supply and demand zones on the chart and receive key signals for entry or exit. Below is a detailed explanation of its functionality:
Features and Applications:
1. Identifying Supply and Demand Zones:
• Supply (Resistance) and Demand (Support) zones are visually displayed on the chart.
• Each zone is marked with a specific color (Yellow for supply, Blue for demand) for easy identification.
2. Breakout and Reversal Signals:
• The indicator detects Breakout and Reversal patterns and highlights them with alerts.
• Example: Detecting price breaking above or below key levels.
3. Candlestick Pattern Support:
• Identifies powerful patterns such as Bullish Engulf, Bearish Engulf, Three White Soldiers, and Three Black Crows.
4. Displaying Zone Strength:
• The indicator shows the strength of supply and demand zones using text displayed inside each zone.
5. Alerts:
• Provides alerts for zone breakouts, breakdowns, and new zone formations.
• Example: Alerts for breaking a demand or supply zone.
How to Use:
1. Adding to the Chart:
• The indicator can be applied to any time frame and is suitable for Forex, stocks, or cryptocurrency charts.
2. Identifying Trading Opportunities:
• Demand zones indicate strong support levels where prices are likely to rise.
• Supply zones indicate resistance levels where prices are likely to fall.
3. Examining Zone Strength:
• The strength of each zone is displayed with text inside the zone.
Indicator Settings:
• Zone Colors:
• The default colors for supply and demand zones are yellow and blue, but they can be customized.
• Alerts:
• Configurable alerts for breakouts or reversals.
Advantages:
• Automatic detection of key price levels.
• Accurate and timely alerts for trades.
• Customizable for professional traders.
Note: This indicator is designed for technical analysis and should be used alongside a suitable trading strategy.
Note di rilascio
Indicator Description: “Order Block Plus”This indicator is designed for traders who aim to identify the strength and position of supply and demand zones on the chart and receive key signals for entry or exit. Below is a detailed explanation of its functionality:
Features and Applications:
1. Identifying Supply and Demand Zones:
• Supply (Resistance) and Demand (Support) zones are visually displayed on the chart.
• Each zone is marked with a specific color (Yellow for supply, Blue for demand) for easy identification.
2. Breakout and Reversal Signals:
• The indicator detects Breakout and Reversal patterns and highlights them with alerts.
• Example: Detecting price breaking above or below key levels.
3. Candlestick Pattern Support:
• Identifies powerful patterns such as Bullish Engulf, Bearish Engulf, Three White Soldiers, and Three Black Crows.
4. Displaying Zone Strength:
• The indicator shows the strength of supply and demand zones using text displayed inside each zone.
5. Alerts:
• Provides alerts for zone breakouts, breakdowns, and new zone formations.
• Example: Alerts for breaking a demand or supply zone.
How to Use:
1. Adding to the Chart:
• The indicator can be applied to any time frame and is suitable for Forex, stocks, or cryptocurrency charts.
2. Identifying Trading Opportunities:
• Demand zones indicate strong support levels where prices are likely to rise.
• Supply zones indicate resistance levels where prices are likely to fall.
3. Examining Zone Strength:
• The strength of each zone is displayed with text inside the zone.
Indicator Settings:
• Zone Colors:
• The default colors for supply and demand zones are yellow and blue, but they can be customized.
• Alerts:
• Configurable alerts for breakouts or reversals.
Advantages:
• Automatic detection of key price levels.
• Accurate and timely alerts for trades.
• Customizable for professional traders.
Note: This indicator is designed for technical analysis and should be used alongside a suitable trading strategy.
Note di rilascio
“Minor visual update: Changed the color scheme of the Order Block boxes for better clarity.”Script open-source
Nello spirito di TradingView, l'autore di questo script lo ha reso open source, in modo che i trader possano esaminarne e verificarne la funzionalità. Complimenti all'autore! Sebbene sia possibile utilizzarlo gratuitamente, ricordiamo che la ripubblicazione del codice è soggetta al nostro Regolamento.
Declinazione di responsabilità
Le informazioni e le pubblicazioni non sono intese come, e non costituiscono, consulenza o raccomandazioni finanziarie, di investimento, di trading o di altro tipo fornite o approvate da TradingView. Per ulteriori informazioni, consultare i Termini di utilizzo.
Script open-source
Nello spirito di TradingView, l'autore di questo script lo ha reso open source, in modo che i trader possano esaminarne e verificarne la funzionalità. Complimenti all'autore! Sebbene sia possibile utilizzarlo gratuitamente, ricordiamo che la ripubblicazione del codice è soggetta al nostro Regolamento.
Declinazione di responsabilità
Le informazioni e le pubblicazioni non sono intese come, e non costituiscono, consulenza o raccomandazioni finanziarie, di investimento, di trading o di altro tipo fornite o approvate da TradingView. Per ulteriori informazioni, consultare i Termini di utilizzo.