PROTECTED SOURCE SCRIPT
TradeCrafted - Previous 10 Highs and Lows
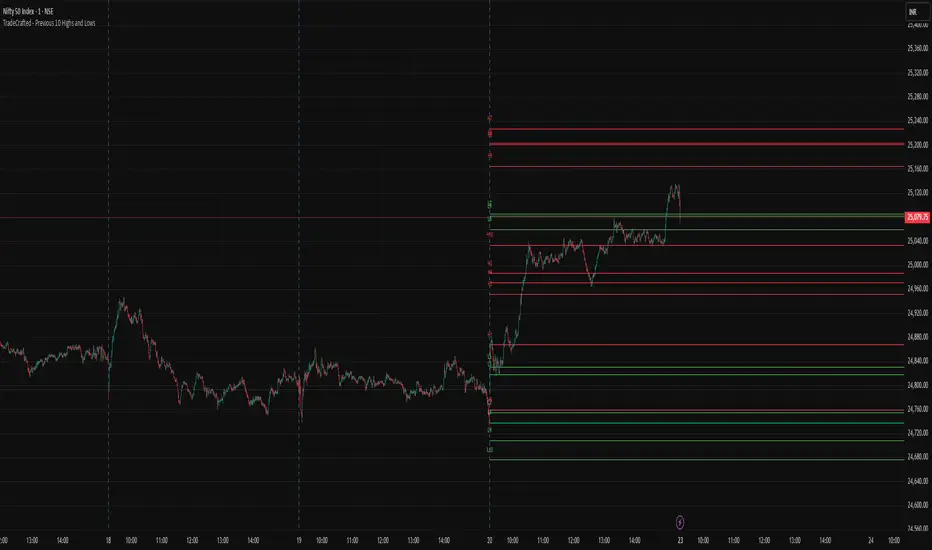
Unlock the power of historical price action with the 10-Day Highs & Lows Indicator! This innovative tool analyzes the highest and lowest price levels of the past 10 trading days and projects them as fixed lines onto the current session. By plotting these crucial support and resistance levels, traders gain a clear visual edge to anticipate market reactions, trend reversals, and breakout opportunities.
🔥 Key Features:
✅ Precision Levels – Automatically plots the previous 10 days' highs and lows for accurate decision-making.
✅ Fixed Lines for Clarity – Levels remain unchanged throughout the session, providing a stable reference.
✅ Enhanced Market Structure Analysis – Identify key zones where price is likely to react.
✅ Ideal for All Traders – Whether you're a scalper, swing trader, or intraday enthusiast, these levels offer a strong foundation for your strategy.
🚀 Why Use This Indicator?
Markets move in cycles, and historical highs and lows act as magnets for price action. By integrating this tool into your trading arsenal, you can spot potential breakouts, retests, and reversals with greater confidence!
Elevate your technical analysis and trade smarter with the 10-Day Highs & Lows Indicator! 🔥
How to use : Trader Can take Buy entry if price is near line and taking reversal from it so it will be very good for trader to manage the stop loss. Simply if it goes below the line, just cut the trade to avoid unnecessary and huge loss. This Indicator will help Trader to take correct entry and exit.
Hope my effort will help trader to stay in profit.
Script protetto
Questo script è pubblicato come codice protetto. Tuttavia, è possibile utilizzarle liberamente e senza alcuna limitazione – ulteriori informazioni qui.
Declinazione di responsabilità
Le informazioni e le pubblicazioni non sono intese come, e non costituiscono, consulenza o raccomandazioni finanziarie, di investimento, di trading o di altro tipo fornite o approvate da TradingView. Per ulteriori informazioni, consultare i Termini di utilizzo.