OPEN-SOURCE SCRIPT
Luxy trend & Momentum Indicators Suit V2
Luxy Trend & Momentum Indicator Suite V2
The Luxy Trend & Momentum Suite V2 is a multi-purpose technical analysis tool designed to help traders quickly identify high-probability trend-following and momentum-based entries across timeframes.
This tool combines the most battle-tested market filters (EMAs, VWAP, MACD, ZLSMA, Supertrend, UT Bot, Volume/ADX/RSI filters) into a unified signal framework — backed by an optional Bias Table that displays alignment across methods and timeframes.
BACKGROUND — ABOUT THIS METHOD
This Indicators Suite is based on momentum-trend alignment, a trading methodology that:
* Confirms trend structure using moving averages (EMA crossovers & price vs EMA-200),
* Validates trend strength using MACD separation, volume pressure, and ADX confirmation,
* Confirms timing using momentum oscillators (RSI pullbacks), VWAP positioning, and trend filters,
* Optionally delays entries using the UT Bot trailing confirmation or Supertrend.
It's a multi-layered filtering helps reduce false signals, especially in choppy conditions.
USAGE
This indicator is best suited for:
It is especially powerful on assets with well-defined structure (e.g., crypto, indices, high-volume stocks).
Signal Labels
The script plots `LONG` (green) or `SHORT` (red) labels when all your configured filters align.
✅ To use these labels effectively:

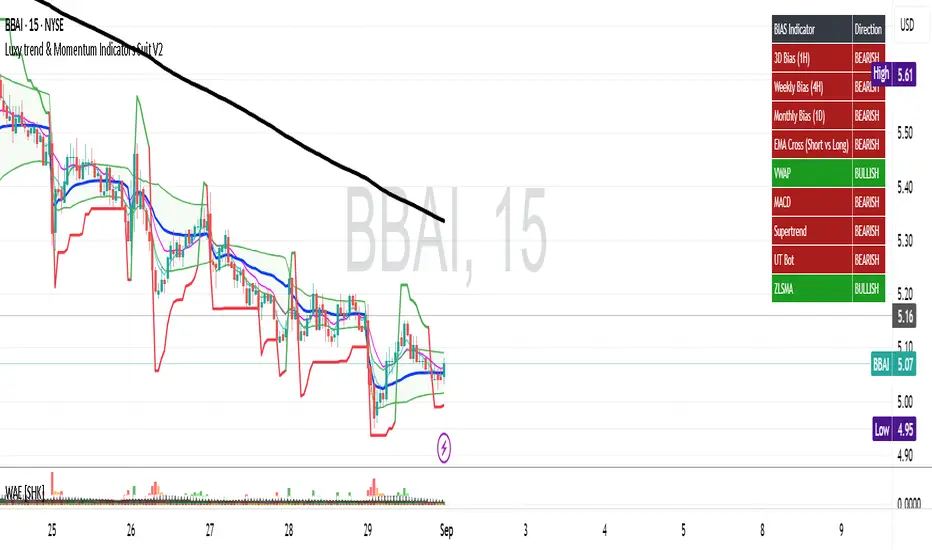
Bias Table Panel
The indicator features a compact Bias summary table, showing the current directional bias from:
Each cell is color-coded:
🟢 Green = Bullish
🔴 Red = Bearish
⚪ Gray = Neutral

Trend Filters
These are the primary trend components:

Momentum & Entry Filters
The indicator offers several modular filters to refine entry signals:
✅ MACD Separation: Requires a minimum spread between MACD and Signal line (adjustable in ATR units).
✅ VWAP Filter: Confirms that price is above/below anchored VWAP.
✅ RSI Pullback Zone: Only triggers signals when RSI is between configured pullback ranges.
✅ Volume Strength: Only confirms signals when current volume is above SMA × factor (e.g. 1.2×).
✅ ADX/DI Filter: Enforces trend strength requirements based on ADX, DI+ and DI-.

RECOMMENDED WORKFLOWS
🔹 Intraday Trend Trading
🔹 Swing Trading
🔹 Position Trading

SETTINGS
You can customize:
Each input includes tooltips with suggested ranges and explanations.
🔶 LIMITATIONS
Always backtest, adjust filters per asset, and confirm entries with price action and context.
📧 Feedback & improvement requests: [orenluxy@gmail.com]
The Luxy Trend & Momentum Suite V2 is a multi-purpose technical analysis tool designed to help traders quickly identify high-probability trend-following and momentum-based entries across timeframes.
This tool combines the most battle-tested market filters (EMAs, VWAP, MACD, ZLSMA, Supertrend, UT Bot, Volume/ADX/RSI filters) into a unified signal framework — backed by an optional Bias Table that displays alignment across methods and timeframes.
BACKGROUND — ABOUT THIS METHOD
This Indicators Suite is based on momentum-trend alignment, a trading methodology that:
* Confirms trend structure using moving averages (EMA crossovers & price vs EMA-200),
* Validates trend strength using MACD separation, volume pressure, and ADX confirmation,
* Confirms timing using momentum oscillators (RSI pullbacks), VWAP positioning, and trend filters,
* Optionally delays entries using the UT Bot trailing confirmation or Supertrend.
It's a multi-layered filtering helps reduce false signals, especially in choppy conditions.
USAGE
This indicator is best suited for:
- Intraday trend trading (scalping or day trading),
- Swing trading based on HTF confirmation (1D/1W),
- Combining bias + technical signal + volume + price context for cleaner entries.
It is especially powerful on assets with well-defined structure (e.g., crypto, indices, high-volume stocks).
Signal Labels
The script plots `LONG` (green) or `SHORT` (red) labels when all your configured filters align.
✅ To use these labels effectively:
- Only take LONG signals when the bias table shows green ("BULLISH"),
- Only take SHORT when the bias table shows red ("BEARISH"),
- Avoid signals on NEUTRAL bias (gray), or consider smaller positions.
Bias Table Panel
The indicator features a compact Bias summary table, showing the current directional bias from:
- Timeframe trends (1H, 4H, 1D)
- Indicator states (EMA cross, EMA200, VWAP, MACD, ZLSMA, UT Bot, Supertrend)
Each cell is color-coded:
🟢 Green = Bullish
🔴 Red = Bearish
⚪ Gray = Neutral
Trend Filters
These are the primary trend components:
- EMA Short vs Long: Fast/Slow structure
- EMA-200: Long-term bias
- ZLSMA: Zero-lag regression slope
- Supertrend: Dynamic trendline with noise-filtering
- UT Bot: ATR-based trailing signal with optional filters (swing, %change, delay)
Momentum & Entry Filters
The indicator offers several modular filters to refine entry signals:
✅ MACD Separation: Requires a minimum spread between MACD and Signal line (adjustable in ATR units).
✅ VWAP Filter: Confirms that price is above/below anchored VWAP.
✅ RSI Pullback Zone: Only triggers signals when RSI is between configured pullback ranges.
✅ Volume Strength: Only confirms signals when current volume is above SMA × factor (e.g. 1.2×).
✅ ADX/DI Filter: Enforces trend strength requirements based on ADX, DI+ and DI-.
RECOMMENDED WORKFLOWS
🔹 Intraday Trend Trading
- Primary TF: "1H"
- Confirmation: "4H"
- Bias method: EMA(20/50) or ZLSMA
- Lookback: 5 bars
- VWAP: Session anchor
- UT Bot: Enabled with 1.3 sensitivity, ATR=10
🔹 Swing Trading
- Primary TF: "1D"
- Confirmation: "1W"
- Bias method: EMA(20/50) or MACD
- Lookback: 10–20
- VWAP: Weekly or Monthly
- UT Bot: Disabled or conservative (1.7 key, ATR=14)
🔹 Position Trading
- Primary: "1W"
- Confirmation: "1M"
- Bias method: EMA(50/200)
- Filters: Strong MACD + Volume + ADX
- UT: Disabled
SETTINGS
You can customize:
- All EMA lengths (short, long, very long)
- MACD periods and buffer thresholds
- VWAP anchor and bands mode (Std Dev or %)
- ZLSMA length and offset
- UT Bot sensitivity, ATR, and filters
- Supertrend ATR logic and neutral bars
- Volume, ADX, RSI, and Donchian breakouts
- Table text size, position, and visibility
Each input includes tooltips with suggested ranges and explanations.
🔶 LIMITATIONS
- This is an **indicator**, not a strategy. It does **not place orders**.
- UT Bot and Bias alignment work better on assets with structure and volume.
- Repainting is avoided by using bar close logic where possible.
- Corporate-event VWAPs (Earnings, Dividends) depend on data availability.
Always backtest, adjust filters per asset, and confirm entries with price action and context.
📧 Feedback & improvement requests: [orenluxy@gmail.com]
Script open-source
In pieno spirito TradingView, il creatore di questo script lo ha reso open-source, in modo che i trader possano esaminarlo e verificarne la funzionalità. Complimenti all'autore! Sebbene sia possibile utilizzarlo gratuitamente, ricorda che la ripubblicazione del codice è soggetta al nostro Regolamento.
Declinazione di responsabilità
Le informazioni ed i contenuti pubblicati non costituiscono in alcun modo una sollecitazione ad investire o ad operare nei mercati finanziari. Non sono inoltre fornite o supportate da TradingView. Maggiori dettagli nelle Condizioni d'uso.