OPEN-SOURCE SCRIPT
DS_Gurukul_5minTrend
DS Gurukul (DS_5minTrend) Indicator: A Simple Yet Powerful Trend Tool
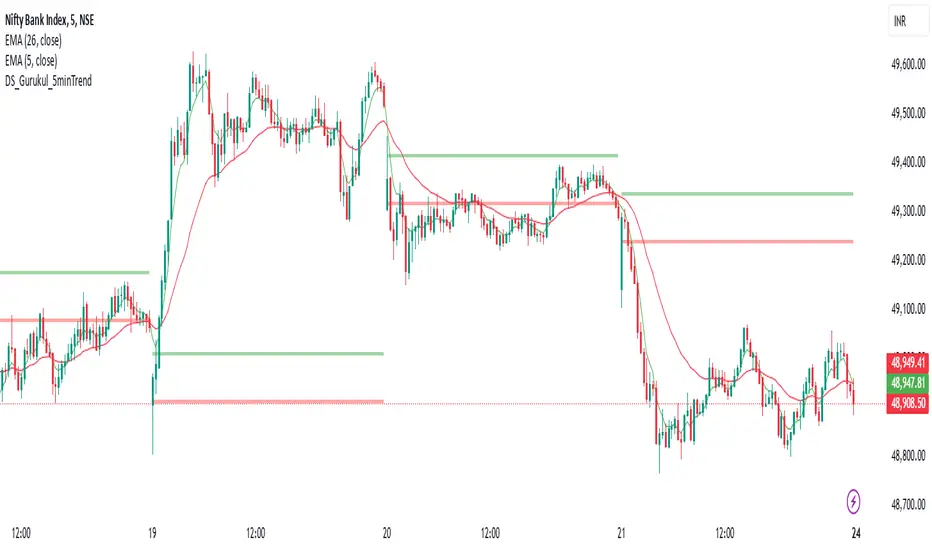
The Tushar Daily Bands (DS_5minTrend) indicator is a straightforward tool designed to help traders quickly visualize potential trend reversals and identify profitable trading opportunities. This indicator plots two bands—an upper band (green) and a lower band (red)—based on a small percentage deviation from the closing price of the first candle of each trading day.
How it Works:
The DS_5minTrend indicator calculates these bands at the start of each new trading day. The bands then remain fixed for the rest of that day. This daily reset allows traders to easily see how the current day's price action relates to the opening price and the calculated bands.
Trading Signals:
Potential Reversals: When the price approaches or touches the upper band (green), it can signal a potential overbought condition and a possible reversal to the downside. Conversely, when the price approaches or touches the lower band (red), it can suggest an oversold condition and a possible reversal to the upside.
Trend Confirmation: If the price consistently closes above the upper band for several periods, it may indicate a strong uptrend. Conversely, consistent closes below the lower band can suggest a strong downtrend.
Support and Resistance: The bands can also act as dynamic support and resistance levels. Traders can watch for price bounces off these levels as potential entry points.
How to Use:
Combine with other indicators: While DS_5minTrend can provide valuable insights, it's generally recommended to use it in conjunction with other technical indicators, such as RSI, MACD, or volume analysis, for confirmation.
Consider market context: Always consider the broader market context and news events that may be influencing price action.
Risk Management: Implement proper risk management strategies, including stop-loss orders, to protect your capital.
Disclaimer: The DS_5minTrend indicator is a tool for analysis and should not be the sole basis for making trading decisions. Trading involves substantial risk, and you could lose money. Always do your own research and consult with a financial advisor before making any investment decisions.
Script open-source
Nello spirito di TradingView, l'autore di questo script lo ha reso open source, in modo che i trader possano esaminarne e verificarne la funzionalità. Complimenti all'autore! Sebbene sia possibile utilizzarlo gratuitamente, ricordiamo che la ripubblicazione del codice è soggetta al nostro Regolamento.
Declinazione di responsabilità
Le informazioni e le pubblicazioni non sono intese come, e non costituiscono, consulenza o raccomandazioni finanziarie, di investimento, di trading o di altro tipo fornite o approvate da TradingView. Per ulteriori informazioni, consultare i Termini di utilizzo.