OPEN-SOURCE SCRIPT
Aggiornato Market Open - Relative Volume

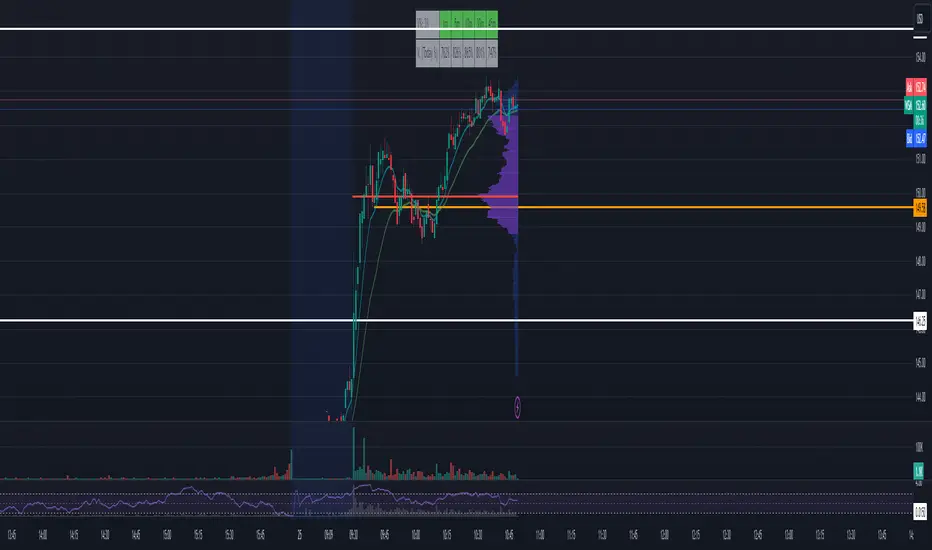
The indicator calculates the Pre-market volume percentage of the current day, relative to the average volume being traded in the trading session (14 days), displayed in Table Row 1, Table Cell 1, as V%. Pre-market volume between 15% & 30% has a orange background color. Pre-market volume percentage above 30% has a green background color.
The indicator calculates the relative volume per candle relative to the average volume being traded in that time period (14 days) (e.g., "1M," "2M," up to "5M"), displayed in a table. Relative volume between 250% & 350% has a orange background color. Relative volume above 350% has a green background color.
FYI >> Indicator calculations are per candle, not time unit (due to pine script restrictions). Meaning, the indicator current table data is only accurate in the 1M chart. If you are using the indicator in a higher timeframe, e.g., on the 5M chart, then the values in table cells >> (1M value == relative volume of the first 5-minute candle) (5M value = relative volume of the first five 5-minute candles) and so on. (Future versions will have a dynamic table).
Note di rilascio
The indicator calculates the Pre-market volume percentage of the current day, relative to the average volume being traded in the trading session (14 days), displayed in Table Row 1, Table Cell 1, as V%. Pre-market volume between 15% & 30% has a orange background color. Pre-market volume percentage above 30% has a green background color.The indicator calculates the relative volume per candle relative to the average volume being traded in that time period (14 days) (e.g., "1M," "2M," up to "5M"), displayed in a table. Relative volume between 250% & 350% has a orange background color. Relative volume above 350% has a green background color.
FYI >> Indicator calculations are per candle, not time unit (due to pine script restrictions). Meaning, the indicator current table data is only accurate in the 1M chart. If you are using the indicator in a higher timeframe, e.g., on the 5M chart, then the values in table cells >> (1M value == relative volume of the first 5-minute candle) (5M value = relative volume of the first five 5-minute candles) and so on. (Future versions will have a dynamic table).
Script open-source
Nello spirito di TradingView, l'autore di questo script lo ha reso open source, in modo che i trader possano esaminarne e verificarne la funzionalità. Complimenti all'autore! Sebbene sia possibile utilizzarlo gratuitamente, ricordiamo che la ripubblicazione del codice è soggetta al nostro Regolamento.
Declinazione di responsabilità
Le informazioni e le pubblicazioni non sono intese come, e non costituiscono, consulenza o raccomandazioni finanziarie, di investimento, di trading o di altro tipo fornite o approvate da TradingView. Per ulteriori informazioni, consultare i Termini di utilizzo.