Provides a unique and visually stunning way to analyze the similarity between various stock market indices. This script uses a range of mathematical measures to calculate the correlation between different assets, such as indices, forex, crypto, etc..
Key Features:
How it Works:
Visual Insights:
Overall, MASM is a powerful tool for market analysis and visualization, offering a unique perspective on the relationships between various assets.
~llama3
Key Features:
- Similarity Measures: The script offers a range of similarity measures to choose from, including SSD (Sum of Squared Differences), Euclidean Distance, Manhattan Distance, Minkowski Distance, Chebyshev Distance, Correlation Coefficient, Cosine Similarity, Camberra Index, Mean Absolute Error (MAE), Mean Squared Error (MSE), Lorentzian Function, Intersection, and Penrose Shape.
- Asset Selection: Users can select the assets they want to analyze by entering a comma-separated list of tickers in the "Asset List" input field.
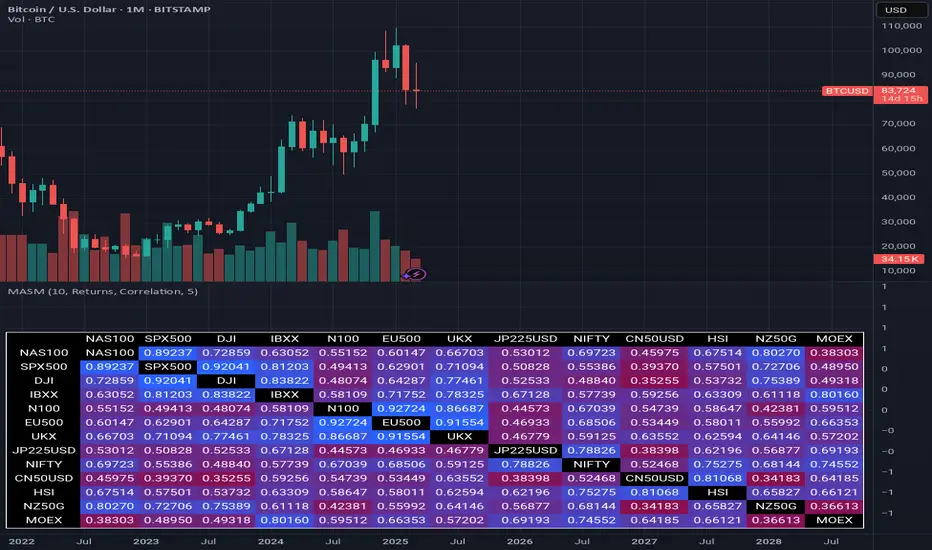
- Color Gradient: The script uses a color gradient to represent the similarity values between each pair of indices, with red indicating low similarity and blue indicating high similarity.
How it Works:
- The script calculates the source method (Returns or Volume Modified Returns) for each index using the sec function.
- It then creates a matrix to hold the current values of each index over a specified window size (default is 10).
- For each pair of indices, it applies the selected similarity measure using the select function and stores the result in a separate matrix.
- The script calculates the maximum and minimum values of the similarity matrix to normalize the color gradient.
- Finally, it creates a table with the index names as rows and columns, displaying the similarity values for each pair of indices using the calculated colors.
Visual Insights:
- The indicator provides an intuitive way to visualize the relationships between different assets.
- By analyzing the color-coded tables, traders can gain insights into:
- Which assets are highly correlated (blue) or uncorrelated (red)
- The strength and direction of these correlations
- Potential trading opportunities based on similarities and differences between assets
Overall, MASM is a powerful tool for market analysis and visualization, offering a unique perspective on the relationships between various assets.
~llama3
Note di rilascio
Added asset name to the diagonal cells, optional number of digits.Note di rilascio
Update chart image.Note di rilascio
Fixed a issue with the gradient color selection.Note di rilascio
Fixed a issue with the correlation, thanks to: truongnldangky, scorpion1405 for noticing.Script open-source
Nello spirito di TradingView, l'autore di questo script lo ha reso open source, in modo che i trader possano esaminarne e verificarne la funzionalità. Complimenti all'autore! Sebbene sia possibile utilizzarlo gratuitamente, ricordiamo che la ripubblicazione del codice è soggetta al nostro Regolamento.
Declinazione di responsabilità
Le informazioni e le pubblicazioni non sono intese come, e non costituiscono, consulenza o raccomandazioni finanziarie, di investimento, di trading o di altro tipo fornite o approvate da TradingView. Per ulteriori informazioni, consultare i Termini di utilizzo.
Script open-source
Nello spirito di TradingView, l'autore di questo script lo ha reso open source, in modo che i trader possano esaminarne e verificarne la funzionalità. Complimenti all'autore! Sebbene sia possibile utilizzarlo gratuitamente, ricordiamo che la ripubblicazione del codice è soggetta al nostro Regolamento.
Declinazione di responsabilità
Le informazioni e le pubblicazioni non sono intese come, e non costituiscono, consulenza o raccomandazioni finanziarie, di investimento, di trading o di altro tipo fornite o approvate da TradingView. Per ulteriori informazioni, consultare i Termini di utilizzo.