OPEN-SOURCE SCRIPT
Untouched Extremes
What it is
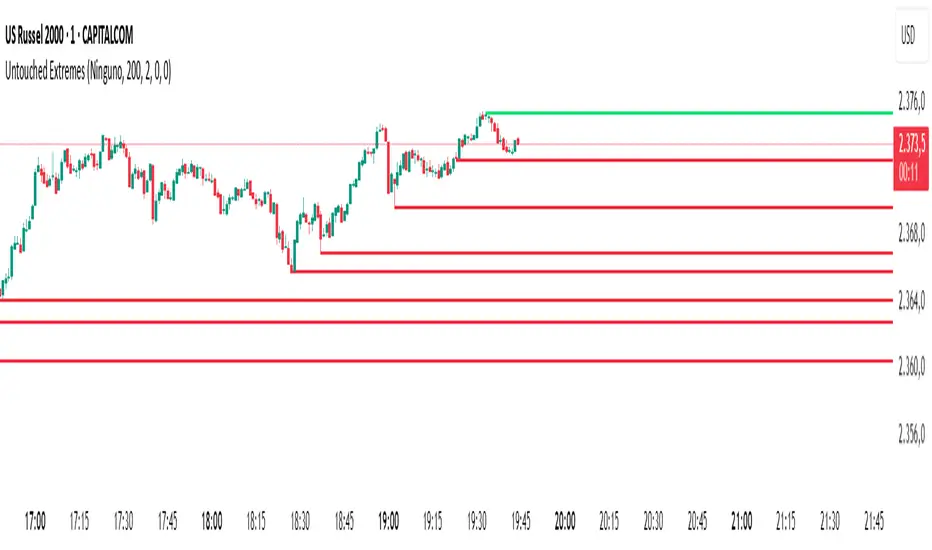
Untouched Extremes plots horizontal levels at green-candle highs and red-candle lows. Each level is considered “untouched” (clean liquidity) until price revisits it; on the first valid touch the line auto-deletes, keeping only live targets on your chart.
How it works (logic)
Bar close event
If close > open, the script draws a line at that bar’s high and extends it to the right.
If close < open, it draws a line at that bar’s low and extends it to the right.
(Optional) Perfect/almost-dojis can be classified as green or red via settings.
Touch & removal
A green-high line is removed when any later bar’s high ≥ level (optionally within a tick tolerance).
A red-low line is removed when any later bar’s low ≤ level (optionally within a tick tolerance).
You can delay deletion by N bars to make the touch visible before the line disappears.
Housekeeping
Maximum active lines per side and line styling are user-configurable.
Why it’s useful
Untouched highs/lows often coincide with resting liquidity and incomplete price probes. Tracking them helps:
Define targets and magnets price may seek.
Frame mean-reversion rotations after a failed push.
Keep the chart clean: only levels that have not been traded are displayed.
How to use it (trading idea)
Confirmation rule: Treat the line as a level/zone. Price can pierce it; wait for a clear reversal candle pattern (e.g., pin bar, engulfing, strong momentum shift) at or immediately after the touch.
Directional play:
If a bullish reversal pattern forms at/around a red-low line, the working assumption is that price will move toward the first untouched upper line (nearest green-high line above). Many traders use that as the primary target.
Conversely, if a bearish reversal pattern forms at/around a green-high line, expect rotation toward the first untouched lower line.
Risk management: Stops typically go just beyond the level or beyond the pattern’s wick. Consider a fixed R:R (e.g., 1:2) and partials at intermediate levels.
Settings
Doji handling: Choose how to classify close ≈ open bars (Green / Red / Ignore). A small equality margin (ticks) helps with rounding on some symbols.
Touch tolerance (ticks): Counts near-misses as touches if desired.
Deletion delay (bars): Wait N bars after creation before a line becomes eligible for deletion.
Max lines per side / width / colors: Keep the view readable.
Tips
Works on any symbol/timeframe; lower TFs produce more levels—adjust Max lines accordingly.
Combining with a trend filter (e.g., EMA-200), ATR distance, or volume clues can improve selectivity.
If spreads or wicks are noisy, increase tolerance slightly and/or use deletion delay to visualize touches.
Note: This tool provides structure and potential targets, not signals by itself. Always require your reversal pattern as confirmation and manage risk appropriately.
Script open-source
Nello spirito di TradingView, l'autore di questo script lo ha reso open source, in modo che i trader possano esaminarne e verificarne la funzionalità. Complimenti all'autore! Sebbene sia possibile utilizzarlo gratuitamente, ricordiamo che la ripubblicazione del codice è soggetta al nostro Regolamento.
Declinazione di responsabilità
Le informazioni e le pubblicazioni non sono intese come, e non costituiscono, consulenza o raccomandazioni finanziarie, di investimento, di trading o di altro tipo fornite o approvate da TradingView. Per ulteriori informazioni, consultare i Termini di utilizzo.