OPEN-SOURCE SCRIPT
Aggiornato Strong/Weak Candle Finder
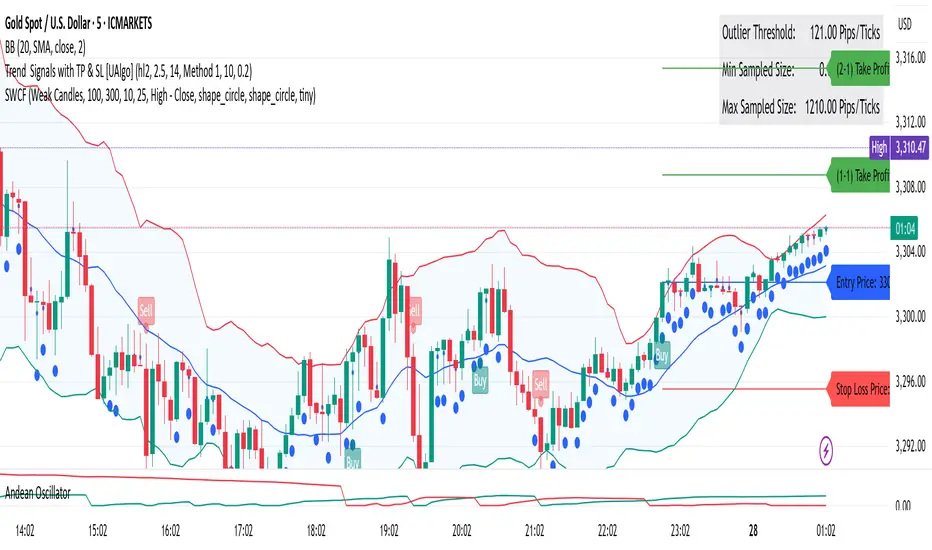
Strong/Weak Candle Finder (SWCF)
Overview:
The Strong/Weak Candle Finder (SWCF) is a versatile TradingView indicator designed to help traders identify statistically significant candles based on their size relative to recent historical price action. By analyzing a lookback period, the indicator dynamically calculates a threshold to classify candles as either "strong" (larger than the threshold) or "weak" (smaller than the threshold), providing visual cues directly on your chart.
This tool can be invaluable for traders looking to:
Spot potential momentum breakouts or high volatility (Strong Candles).
Identify periods of consolidation or low volatility (Weak Candles).
Gauge shifts in market sentiment based on candle body or range dynamics.
How It Works:
Candle Size Calculation: You choose how candle size is measured from four methods:
High - Low: The full range of the candle.
High - Close: The distance from the high to the close.
Open - Close: The size of the candle body.
Low - Open: The distance from the low to the open.
Historical Analysis: The indicator looks back over a user-defined LookBack Period to collect candle sizes.
Grouping & Precision: To smooth the distribution, candle sizes are grouped based on the Group Precision Size. This parameter divides the observed range of candle sizes into a set number of "bins," and individual candle sizes are rounded to the nearest representative value of these bins.
Percentile Threshold: A dynamic Outlier Pip Value is calculated based on the Outlier Percentile you set.
If Display Mode is "Strong Candles," this threshold represents the Nth percentile of the largest candle sizes (e.g., the 80th percentile if Outlier Percentile is 20%). Candles larger than this are marked as "Strong."
If Display Mode is "Weak Candles," this threshold represents the Nth percentile of the smallest candle sizes (e.g., the 20th percentile). Candles smaller than this are marked as "Weak."
Visual Markers: When a current candle meets the criteria (strong or weak based on your display mode), a configurable shape is plotted above (for strong) or below (for weak) the candle.
Resampling: The historical distribution and outlier threshold are recalculated every Resample Period (number of bars) to adapt to changing market conditions.
Key Features:
Dynamic Thresholds: Adapts to market volatility instead of using fixed pip values.
Customizable Candle Definition: Choose from four methods to define what "candle size" means to your strategy.
Flexible Display Modes: Focus on either identifying exceptionally strong candles or unusually weak ones.
Adjustable Sensitivity: Fine-tune the rarity of signals with Outlier Percentile and Group Precision Size.
Visual Chart Markers: Clear, customizable shapes (arrow, circle, etc.) for easy identification.
Periodic Recalculation: Ensures the indicator remains relevant as market dynamics evolve.
Parameters:
Display Mode:
Strong Candles: Highlights candles larger than the upper percentile threshold.
Weak Candles: Highlights candles smaller than the lower percentile threshold.
Resample Period (Candles): How often (in bars) to recalculate the historical distribution and outlier threshold.
LookBack Period (Candles): The number of past candles to analyze for the historical distribution. (Note: Plots will only begin after this many bars have loaded on the chart).
Group Precision Size: Number of groups to divide the candle size range into for rounding historical sizes. Higher values mean finer precision (less rounding).
Outlier Percentile (%): The percentile used to define the threshold for strong/weak candles.
Candle Size Method: (High-Low, High-Close, Open-Close, Low-Open).
Visuals:
Strong Shape: Choose the icon style for strong candles.
Weak Shape: Choose the icon style for weak candles.
Shape Size: Adjust the size of the plotted icons.
How to Use:
Strong Candles:
May indicate increased momentum, potential breakout confirmations, or high conviction moves.
Consider using in trending markets or as a filter for entry signals.
Weak Candles:
May signal market indecision, low volatility, consolidation phases, or potential exhaustion of a prior move.
Can be useful for identifying range-bound conditions or periods to be cautious.
Experimentation: Adjust the LookBack Period, Outlier Percentile, and Group Precision Size to match your trading style and the characteristics of the asset you are trading. What constitutes "strong" or "weak" can vary significantly.
Confirmation Tool: Use in conjunction with other indicators (e.g., moving averages, RSI, volume) for more robust trading decisions.
Important Notes:
The indicator requires sufficient historical data (LookBack Period) to initialize. You may not see plots on the chart immediately if there aren't enough bars loaded.
Like all indicators, the SWCF is not a standalone trading system and should not be used as the sole basis for financial decisions.
Past performance is not indicative of future results. Always use appropriate risk management.
We hope you find the Strong/Weak Candle Finder a valuable addition to your trading toolkit!
Note di rilascio
Removed Some unused ParametersNote di rilascio
Fixed bug where outlier gets zeroNote di rilascio
Added parameter for changing text colorScript open-source
Nello spirito di TradingView, l'autore di questo script lo ha reso open source, in modo che i trader possano esaminarne e verificarne la funzionalità. Complimenti all'autore! Sebbene sia possibile utilizzarlo gratuitamente, ricordiamo che la ripubblicazione del codice è soggetta al nostro Regolamento.
Declinazione di responsabilità
Le informazioni e le pubblicazioni non sono intese come, e non costituiscono, consulenza o raccomandazioni finanziarie, di investimento, di trading o di altro tipo fornite o approvate da TradingView. Per ulteriori informazioni, consultare i Termini di utilizzo.
Script open-source
Nello spirito di TradingView, l'autore di questo script lo ha reso open source, in modo che i trader possano esaminarne e verificarne la funzionalità. Complimenti all'autore! Sebbene sia possibile utilizzarlo gratuitamente, ricordiamo che la ripubblicazione del codice è soggetta al nostro Regolamento.
Declinazione di responsabilità
Le informazioni e le pubblicazioni non sono intese come, e non costituiscono, consulenza o raccomandazioni finanziarie, di investimento, di trading o di altro tipo fornite o approvate da TradingView. Per ulteriori informazioni, consultare i Termini di utilizzo.