OPEN-SOURCE SCRIPT
Aggiornato Price Data Label
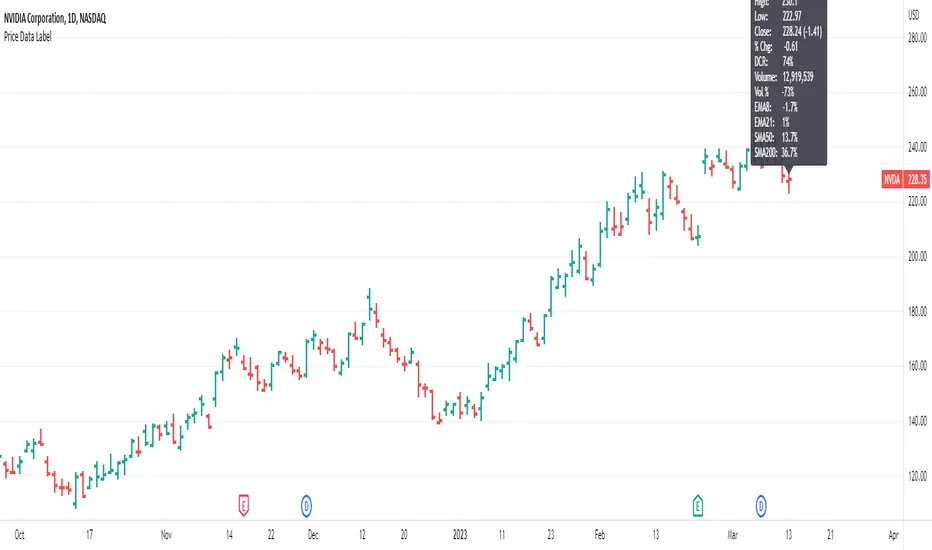
This indicator gives you the ability to see historical data for each bar on the chart by simply hovering over the high of the bar, similar to the functionality of MarketSmith.
Data for each bar includes:
Example of stats on a historical bar:

* Note this only works on the last 500 historical bars. If you use bar replay it will work with 500 historical bars from the last bar.
* If you have multiple indicators on your chart, in order to see the data you will need to use visual order to bring to front. This can be done by clicking the three dots next to the indicator name and selecting visual order.

Data for each bar includes:
- Open
- High
- Low
- Close + Change
- Percentage Change
- Closing Range
- Volume
- Volume Percent based on 50 day average
- Distance to 4 selectable moving averages
Example of stats on a historical bar:
* Note this only works on the last 500 historical bars. If you use bar replay it will work with 500 historical bars from the last bar.
* If you have multiple indicators on your chart, in order to see the data you will need to use visual order to bring to front. This can be done by clicking the three dots next to the indicator name and selecting visual order.
Note di rilascio
Turned off the label always showing that was needed for picture. Note di rilascio
Added moving average values to the labelNote di rilascio
Update to show index volume for the Nasdaq and SPX as well as calculate the index volume percent change vs 50 day average volume. Note di rilascio
Update now allows for selectable weekly moving averages. The label will automatically adjust to the user selected weekly moving averages when looking at a weekly chart. Note di rilascio
Volume % calculation is now based on the run rate to show the projected volume finish compared to the average volume. Note di rilascio
Added a new required parameter to the time format function in the code.Note di rilascio
option to view % as ATRScript open-source
In pieno spirito TradingView, il creatore di questo script lo ha reso open-source, in modo che i trader possano esaminarlo e verificarne la funzionalità. Complimenti all'autore! Sebbene sia possibile utilizzarlo gratuitamente, ricorda che la ripubblicazione del codice è soggetta al nostro Regolamento.
Trusted Pine programmer. Send me a message for script development.
Declinazione di responsabilità
Le informazioni ed i contenuti pubblicati non costituiscono in alcun modo una sollecitazione ad investire o ad operare nei mercati finanziari. Non sono inoltre fornite o supportate da TradingView. Maggiori dettagli nelle Condizioni d'uso.
Script open-source
In pieno spirito TradingView, il creatore di questo script lo ha reso open-source, in modo che i trader possano esaminarlo e verificarne la funzionalità. Complimenti all'autore! Sebbene sia possibile utilizzarlo gratuitamente, ricorda che la ripubblicazione del codice è soggetta al nostro Regolamento.
Trusted Pine programmer. Send me a message for script development.
Declinazione di responsabilità
Le informazioni ed i contenuti pubblicati non costituiscono in alcun modo una sollecitazione ad investire o ad operare nei mercati finanziari. Non sono inoltre fornite o supportate da TradingView. Maggiori dettagli nelle Condizioni d'uso.