OPEN-SOURCE SCRIPT
Intraday FIB Scalping

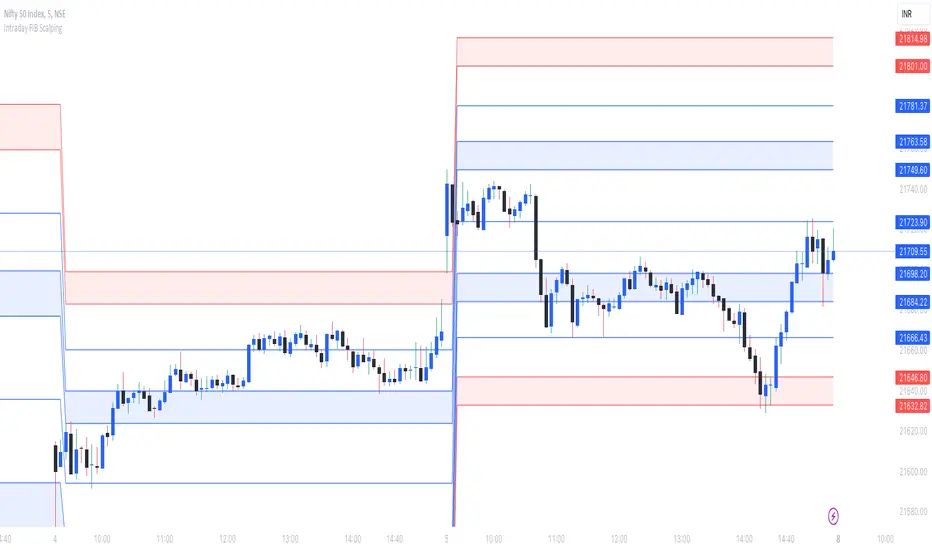
The Intraday Fibonacci Levels Indicator is a powerful tool designed to enhance trading decisions in intraday markets. Leveraging the dynamic nature of Fibonacci retracement levels, this indicator utilizes the high and low prices observed within the first 15 minutes of the trading session to plot key levels and establish potential entry and exit zones.
Key Features:
Automatic Calculation: The indicator swiftly calculates Fibonacci retracement levels based on the highest high and lowest low recorded during the initial 15 minutes of the trading day. This ensures a quick and accurate representation of potential support and resistance levels.
Zone Marking for Precision: The indicator marks specific zones on the chart, providing traders with clear visual cues for potential entry and exit points. These zones are strategically aligned with Fibonacci levels, offering a systematic approach to decision-making.
User-Friendly Interface: With a user-friendly interface, the Intraday Fibonacci Levels Indicator is suitable for both novice and experienced traders. The intuitive design allows for easy interpretation of signals and levels.
By harnessing the power of Fibonacci retracement levels and incorporating them into an intraday context, this indicator empowers traders with a systematic and data-driven approach to decision-making. Whether identifying entry points, setting stop losses, or planning exit strategies, the Intraday Fibonacci Levels Indicator serves as a valuable ally in navigating the complexities of intraday trading.
How to Trade using these Levels?
With this indicator, you can see all the levels between whole number and its corresponding 0.272 were highlighted. That is where we need to look for intraday trade entry. If any of the level broken on either side and the bar closes below ore above the highlighted area, we should enter the trade in that direction with immediate next FIB level as TP1 and subsequent level as TP2. And, an opposite directional close above or below the highlighted level will be considered as stop loss exit.
We prefer to trade in 3 minutes or 5 minutes timeframe for intraday trading.
How we plot the levels?
We are incorporating ORB into Fibonacci to plot intraday trading levels. We use high and low of first 15 minutes candle of each new trading session to arrive the levels for that session.
When market is trading above or below initially plotted levels, user can extend the levels by enabling extentions provided in user settings
Script open-source
Nello spirito di TradingView, l'autore di questo script lo ha reso open source, in modo che i trader possano esaminarne e verificarne la funzionalità. Complimenti all'autore! Sebbene sia possibile utilizzarlo gratuitamente, ricordiamo che la ripubblicazione del codice è soggetta al nostro Regolamento.
Declinazione di responsabilità
Le informazioni e le pubblicazioni non sono intese come, e non costituiscono, consulenza o raccomandazioni finanziarie, di investimento, di trading o di altro tipo fornite o approvate da TradingView. Per ulteriori informazioni, consultare i Termini di utilizzo.