OPEN-SOURCE SCRIPT
Goethe A - Multiple Leading Indicator Package
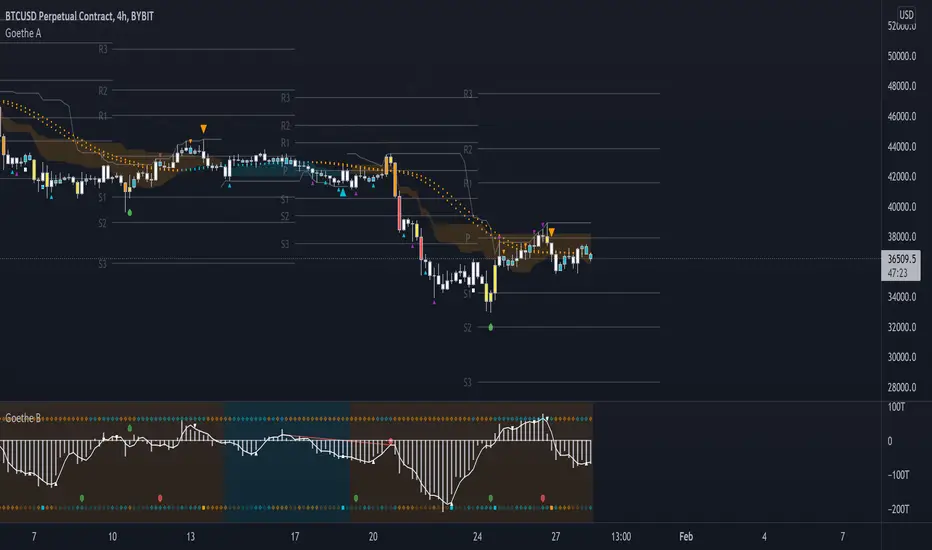
Goethe A is an Indicator Package that contains multiple leading and lagging indicators.
The background is that shows the local trend is calculated by either two Moving Averages or by a Kumo Cloud. By default the Kumo Cloud calculation is used.
What are those circles?
-These are OBV (or VPT, can be set in the options) Divergences. Red for Regular-Bearish. Orange for Hidden-Bearish. Green for Regular-Bullish. Aqua for Hidden-Bullish.
What this middle line?
-The middle line is calculated by a smoothed Heikin-Ashi indicator. I can be used as a dynamic zone of support and resistance. Many times this indicator is used as entry signal giver in trend following strategies.
What are those background lines?
-The background contains a simple Daily Pivots indicator. This indicator can be read as zones of Support and Resistance that updated based on the used timeframe.
What is this smaller thin grey line?
-This is a very simple Stoploss indicator based on Donchian Channels. The trade direction is based and calculated by the local trend (background color)
What are those small orange or aqua triangles?
- These are Pivots . They show when the OBV or wolfpack oscillators (or a double confirmation of both) might reverse, this is important to know because many times the price action follows this move.
What are those purple triangles?
- These are Pivots . They show when the PVT oscillator might reverse, this is important to know because many times the price action follows this move.
What are those big orange or aqua triangles?
- These are TSI (true strength indicator) entry signals . They are calculated by the TSI entry signal, the TSI oscillator treshold and in conjunction with the overall local trend (background color).
What are those white squares?
- These are Overbought or Oversold regions of the build-in RSI bands indicator. Every time the price crosses one of the RSI bands those squares are printed. Most of the time this happens after a move and indicates that this strong move has come to an end.
Most settings of the indicator package can be modified to your liking and based on your chosen strategy might have to be modified. Please keep in mind that this indicator is a tool and not a strategy, do not blindly trade signals, do your own research first! Use this indicator in conjunction with other indicators to get multiple confirmations.
Script open-source
Nello spirito di TradingView, l'autore di questo script lo ha reso open source, in modo che i trader possano esaminarne e verificarne la funzionalità. Complimenti all'autore! Sebbene sia possibile utilizzarlo gratuitamente, ricordiamo che la ripubblicazione del codice è soggetta al nostro Regolamento.
Declinazione di responsabilità
Le informazioni e le pubblicazioni non sono intese come, e non costituiscono, consulenza o raccomandazioni finanziarie, di investimento, di trading o di altro tipo fornite o approvate da TradingView. Per ulteriori informazioni, consultare i Termini di utilizzo.