Emperor RSI Candle
The Emperor RSI Candle is a real-time, non-lagging trading indicator that colors candles based on RSI (Relative Strength Index) levels. It offers instant visual feedback on market momentum, making it easy to identify trend strength, overbought/oversold zones, and potential reversals with precision.
Unlike traditional RSI indicators, which display RSI values in a separate panel, Emperor RSI Candle integrates RSI signals directly into the candles, providing a cleaner, more intuitive charting experience. Its multi-timeframe RSI box shows RSI values across different timeframes, offering confluence confirmation for better trade decisions.
🔥 Emperor RSI Candle is original because it includes a multi-timeframe RSI box that displays RSI values from:
1 min → Monthly timeframes simultaneously.
📊 How this is unique:
Traders can instantly compare RSI values across different timeframes.
This helps them spot confluence and divergences, which is not possible with standard RSI indicators.
The multi-timeframe confluence feature makes the indicator highly effective for both short-term and long-term traders.
🚀 What the script does:
Real-time candle coloring based on RSI levels.
Multi-timeframe RSI box for confluence insights.
Customizable RSI settings for adaptability.
How it benefits traders:
Instant visual feedback for momentum and reversals.
No lag signals for precise trading decisions.
Flexible customization for different trading styles.
Unique visual signals:
Green, red, parrot green, and blue candles → Clearly indicating bullish/bearish momentum and overbought/oversold zones.
Multi-timeframe RSI box → For cross-timeframe confluence.
⚡️ 🔥 UNIQUE FEATURES 🔥:
✅ Multi-Timeframe RSI Box:
Displays RSI values from 1 min to monthly timeframes, helping traders confirm confluence across different timeframes.
✅ Fully Customizable RSI Levels & Display:
Modify RSI thresholds, source, and appearance to fit your trading style.
✅ Dynamic Candle Borders for Weak Signals:
Green border → Weak bullishness (RSI between 50-60).
Red border → Weak bearishness (RSI between 40-50).
✅ Lag-Free, Real-Time Accuracy:
No repainting or delay—instant visual signals for accurate decisions.
✅ Scalable for Any Trading Style:
Perfect for both intraday scalping and positional trading.
📊 🔥 HOW IT WORKS 🔥:
The indicator dynamically colors candles based on RSI values, providing real-time visual signals:
🟢 Above 60 RSI → Green candle:
Indicates bullish momentum, signaling potential upward continuation.
🟩 Above 80 RSI → Parrot green candle:
Overbought zone → Possible reversal or profit booking.
🟥 Below 40 RSI → Red candle:
Signals bearish momentum, indicating potential downward continuation.
🔵 Below 20 RSI → Blue candle:
Oversold zone → Possible reversal opportunity.
🔲 Neutral candles:
50-60 RSI → Green border: Weak bullishness.
40-50 RSI → Red border: Weak bearishness.
📊 🔥 MULTI-TIMEFRAME RSI BOX 🔥:
The Emperor RSI Candle includes an RSI box displaying multi-timeframe RSI values from 1 min to monthly. This provides:
✅ Confluence confirmation:
Compare RSI across multiple timeframes to strengthen trade conviction.
✅ Spot divergences:
Identify hidden trends by comparing smaller and larger timeframes.
✅ Validate trade entries/exits:
Use higher timeframe RSI to confirm smaller timeframe signals
⚙️ 🔥 HOW TO USE IT 🔥:
To maximize the accuracy and clarity of Emperor RSI Candle, follow these steps:
🔧 STEP 1: Chart Settings Configuration
Go to Chart Settings → Symbols
Uncheck the following options:
Body
Borders
Wick
✅ This ensures that only the Emperor Candle colors are visible, making the signals clear and distinct.
🔧 STEP 2: Style Settings for Emperor Candle
After applying the Emperor RSI Candle:
Go to Settings → Style tab
Wick section:
Select Color 2 and Color 3 → Set Opacity to 100%.
Border section:
Select Color 2 and Color 3 → Set Opacity to 100%.
✅ This ensures the candles display with full visibility and accurate colors.
⚙️ 🔥 CUSTOMIZATION OPTIONS 🔥:
Emperor RSI Candle offers full flexibility to match your trading style:
✅ RSI Length:
Modify the period used for RSI calculation (default: 10).
✅ Top & Bottom Levels:
Adjust the overbought (default: 80) and oversold (default: 20) thresholds.
✅ Intermediate Levels:
Up Level: Default: 60 → Bullish RSI threshold.
Down Level: Default: 40 → Bearish RSI threshold.
Mid Level: Default: 50 → Neutral zone.
✅ RSI Source:
Select the price source for RSI calculation (Close, Open, High, Low).
✅ RSI Period:
Customize the RSI calculation period (default: 10).
✅ Font Size:
Adjust the RSI box font size for better visibility.
✅ Box Position:
Choose where to display the RSI box:
Top Left / Top Center / Top Right
Bottom Left / Bottom Center / Bottom Right
💡 🔥 HOW IT IMPROVES TRADING 🔥:
✅ Clear trend identification:
Instantly recognize bullish, bearish, or neutral conditions through candle colors.
✅ Precise entries and exits:
Spot overbought and oversold zones with visual clarity.
✅ Multi-timeframe confirmation:
Validate trades with RSI confluence across multiple timeframes.
✅ No lag, real-time accuracy:
Immediate visual signals for faster and more reliable trade decisions.
✅ Customizable settings:
Tailor the indicator to fit your trading strategy and preferences.
✅ Works for all trading styles:
Suitable for scalping, day trading, and swing trading.
🔥How Traders Can Use Emperor RSI Candle for Trading:
🟢 Green Candles (Above 60 RSI) → Bullish Momentum:
Indicates strong upward movement → Ideal for long entries.
Traders can hold until RSI approaches 80 for profit booking.
🟥 Red Candles (Below 40 RSI) → Bearish Momentum:
Signals strong downward movement → Ideal for short trades.
Traders can exit or book profits near RSI 20.
2. Spotting Overbought and Oversold Zones for Reversals:
🟩 Parrot Green Candles (Above 80 RSI) → Overbought Zone:
Indicates potential for reversals or profit booking.
Traders can tighten stop-losses or exit positions.
🔵 Blue Candles (Below 20 RSI) → Oversold Zone:
Signals a potential reversal opportunity.
Traders can look for buy signals with confluence confirmation.
3. Catching Weak Bullish and Bearish Trends with Border Colors:
🟢 Green Border (RSI 50-60) → Weak Bullishness:
Indicates mild upward momentum.
Traders can consider cautious long entries.
🔴 Red Border (RSI 40-50) → Weak Bearishness:
Indicates mild downward pressure.
Traders can consider cautious short entries.
4. Using the RSI Multi-Timeframe Box for Confluence:
✅ Displays RSI values from 1 min to monthly timeframes.
Usage:
Confluence confirmation:
Multiple timeframes showing bullish RSI → Strong uptrend → Reliable buy signals.
Multiple timeframes showing bearish RSI → Strong downtrend → Reliable sell signals.
Spotting divergences:
If lower timeframes are bullish but higher timeframes are bearish, it indicates a potential reversal.
5. Customization Tips for Different Trading Styles:
✅ For Scalping:
Use a smaller RSI period (9-10) for faster signals.
Check the multi-timeframe RSI box to confirm signals quickly.
✅ For Swing Trading:
Use the default RSI period (14-15) for more accurate signals.
Focus on higher timeframes (1 hr, 4 hr, daily) for stronger trend confirmation.
"Emperor RSI Candle" is a premium RSI-based visual setup that colors candles based on RSI zones and highlights key bullish/bearish levels. Now enhanced with a multi-timeframe RSI dashboard — from 1 minute to Yearly — to give traders a full spectrum of market momentum. Use this to spot oversold/overbought zones, confirm trend strength, and support your buying/selling decisions with confidence. Ideal for intraday, swing, and positional setups.
"Emperor RSI Candle" is a premium RSI-based visual setup that colors candles based on RSI zones and highlights key bullish/bearish levels. Now enhanced with a multi-timeframe RSI dashboard — from 1 minute to Yearly — to give traders a full spectrum of market momentum. Use this to spot oversold/overbought zones, confirm trend strength, and support your buying/selling decisions with confidence. Ideal for intraday, swing, and positional setups.
We've enhanced the Emperor RSI Candle with two powerful new features to give traders deeper clarity and precision:
✅ 1. 10-Minute RSI Analysis Added
Now, the multi-timeframe RSI signal table includes the 10-minute timeframe — a sweet spot for intraday traders and scalpers who want to catch early momentum shifts between 5min and 15min charts.
📊 Benefit: Helps you spot early breakouts or potential reversals with greater precision.
✅ 2. RSI 80 & RSI 20 High-Low Marker Lines
The script now automatically plots horizontal lines at the High and Low of the most recent candles where RSI crossed:
80+ (Overbought / Strong Bullish) – 📈 Parrot Green Lines
20- (Oversold / Strong Bearish) – 📉 Blue Lines
🔍 Benefit:
These levels often act as critical breakout or reversal zones, and now you have them visually marked right on your chart — no guesswork!
💎 Summary of What You Get:
Premium RSI Candle Coloring Based on Momentum Zones
High/Low Line Markers for Last RSI 80+ and 20- Candles
Customizable RSI Table with Multi-Timeframe Readings
Smart Alerts for Extreme Bullish/Bearish RSI Zones
Now includes 10-Minute RSI View for sharper decisions!
The premium RSI-based candle indicator just got smarter and more customizable!
🆕 New Features Added:
🎯 Breakout Line Logic (for Blue & Parrot Green Candles Only):
When a Blue candle streak forms → A line is drawn from the Blue candle.
Line Color Changes if Blue candle High gets Break 1st than Line turn in green
Line Color Changes if Blue candle low gets Break 2nd again than Line turn in red
When a Parrot Green candle streak forms → A line is drawn from the Parrot Green candle.
Line Color Changes if green candle low gets Break 1st than Line turn in red
Line Color Changes if green candle High gets Break 2nd time than Line turn in green
✅ If price breaks that line, the line changes color to indicate a momentum breakout or End of Trend.
❗ Once the breakout happens, the line locks and does not repaint. till new Blue or Parrot Green Candle Appear.
🎨 Full Customization Added:
You can now change the color of:
RSI-based candles (Normal, Parrot Green, Blue, Neutral)
Breakout lines (before and after breakout)
Candle borders
Improved user control and premium look for all chart types.
💎 Why it matters:
This upgrade makes it easy to spot when a strong momentum candle (Blue or Parrot Green) leads to an actual breakout, giving you better confidence in trend continuation or reversal exhaustion.
We’ve enhanced the Emperor RSI Candle indicator with new customizable breakout line colors for better personalization and visual clarity.
What’s new?
Now you can choose your own colors for breakout line highlights on Blue and Parrot Green candles.
Customize High breakout line color and Low breakout line color separately for both Blue and Parrot Green candle signals.
This flexibility helps you match the indicator colors to your chart theme or personal preferences for clearer breakout detection.
How to use?
Open the indicator settings.
Go to the new “Breakout Line Colors” section.
Select your preferred colors for:
Blue Candle High Breakout
Blue Candle Low Breakout
Parrot Green High Breakout
Parrot Green Low Breakout
This update gives you full control over breakout signal visibility and aesthetics — making your trading setup even more powerful and visually appealing!
This latest update enhances the visual feedback of key support and resistance levels drawn from Blue (oversold) and Parrot Green (overbought) candles by dynamically changing line colors based on price action around these levels.
Blue Candle Lines:
Low Line Reaction:
When price closes above the last Blue candle low, the line color changes to a vibrant green, signaling that this support level is holding and buyers are stepping in.
If price closes below, the line turns red, indicating the support has been broken and bearish momentum is increasing.
High Line Reaction:
When price closes above the last Blue candle high, the line turns green, confirming a bullish breakout.
If price closes below, the line switches to red, showing price rejection and a potential reversal or consolidation.
Parrot Green Candle Lines:
High Line Reaction:
A close above the last Parrot Green candle high turns the line green, highlighting strong bullish momentum and support confirmation.
Closing below it turns the line red, signaling a breakdown of bullish support.
Low Line Reaction:
When price closes above the last Parrot Green candle low, the line changes to green, indicating rejection of the level as resistance and possible continuation upwards.
Closing below turns the line red, highlighting a bearish breakdown.
This intelligent color reaction system visually guides traders in real-time by clearly differentiating between support holding vs. breaking and resistance rejection vs. breakout for critical momentum zones defined by Emperor RSI Candles. It empowers you to take decisive trades with enhanced confidence based purely on candle momentum behavior — simplifying complex price action into intuitive color-coded signals.
We’ve added a powerful customization option to the Emperor RSI Candle indicator!
You can now choose how far the key high/low levels (formed by Blue & Parrot Green candles) should extend into the future — from a minimum of 10 bars to a maximum of 500 bars.
🔧 Why this matters:
Focus only on recent candle levels for scalping and intraday setups.
Extend important zones across 500 bars to track long-term reactions and breakouts.
Visually declutter or expand your chart based on your trading style.
📌 Default is set to 500 bars for maximum visibility — adjust it anytime from the settings panel under "Line Length (Bars)".
💡 Combined with our intelligent line reaction system (color change on breakout or rejection), this feature gives you full visual control with zero manual effort.
🔥 Now with 8H & 12H Timeframes! Catch intraday swings & bigger moves with ease.
🎯 Pinpoint precise support & resistance zones using extended breakout lines from the FIRST & LAST RSI 20 & 80 candles.
🌈 Lines automatically change colors on breakout signals — instantly spot bullish 💚 or bearish 🔴 momentum shifts!
⚙️ Fully customizable colors, widths & line lengths — tailor the setup exactly to YOUR style.
✨ Clean, premium visuals so you see ONLY what matters — no clutter, just powerful RSI signals.
How to use?
✔️ Enable your favorite timeframes (including new 8H & 12H!)
✔️ Watch the breakout lines for entry/exit & stoploss guidance
✔️ Combine with Emperor Candle colors for the ultimate RSI momentum edge
Perfect for all traders:
Intraday scalpers, swing traders, option buyers & sellers, and long-term positional investors — this setup is your new secret weapon! ⚔️
Upgrade your charts, upgrade your trades — Emperor RSI Candle, where simplicity meets precision! 💎📈
🔥 We’ve fixed the crucial line color change bug on breakout signals — now your FIRST & LAST RSI 20 & 80 candle breakout lines accurately change colors to reflect bullish 💚 and bearish 🔴 momentum shifts in real-time!
🎯 Extended breakout lines remain fully customizable with your preferred colors, widths, and lengths — delivering the sharp, premium visuals you expect from Emperor RSI Candle.
🌈 This fix ensures instant, reliable visual cues for momentum changes, making your entry, exit, and stoploss decisions clearer than ever.
⚙️ Everything else stays the same — fully compatible with 8H & 12H timeframes and all your favorite setups.
We’ve made your trading experience even smoother and clearer with an important timeframe display upgrade! ⏰✨
🔥 What’s new?
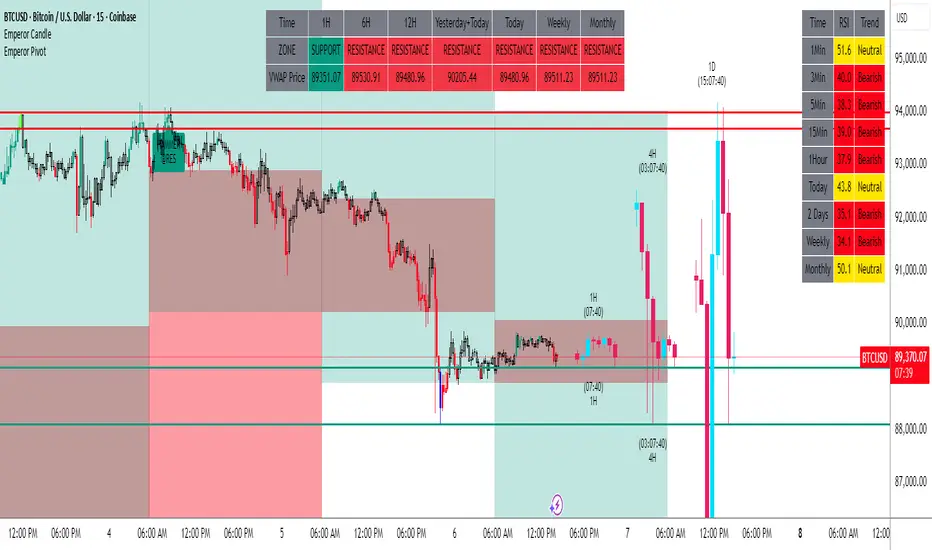
Now, the RSI values in the table show timeframes in a clean, easy-to-read format:
Minutes are displayed with a small “m” — like 1m, 3m, 5m, 10m, 15m, 30m ⏳
Hours are displayed in a neat “H” format — like 1H, 2H, 3H, 4H, up to 12H 🕐
Days, weeks, months, and yearly timeframes stay as 1D, 1W, 1M, 1Y for clarity 📅
This means no more confusing numbers like 60, 120, or 720 minutes! Now you instantly know whether you’re looking at minutes or hours, making it easier and faster to analyze RSI trends across timeframes. 🧠⚡️
🎯 Why it matters:
Improved readability of your RSI dashboard
Faster decision-making with clear timeframe info
Better alignment with common trading terminology
This upgraded version of the Emperor RSI Candle is designed for traders who want precision alerts without noise. It combines dynamic candle coloring based on RSI zones with an intelligent alert engine to notify you only when real momentum shifts happen.
🔔 What’s New – Smart RSI Alert Logic
Now included:
✅ One-time alerts when RSI first crosses above 80 or below 20
❌ No repetitive alerts on every candle while RSI remains in extreme zones
🔁 Alerts reset only after RSI comes back to normal range (between 20–80)
This ensures you get high-quality alerts only at the key breakout moments — perfect for option buyers, scalpers, or momentum traders.
🧠 How It Works
RSI closes above 80 → 🟢 Alert: “RSI Closed Above 80 → Extreme Bullish Zone”
RSI stays above 80 → ❌ No alert (already triggered)
RSI drops below 80 → 🔁 Resets alert
RSI again closes above 80 → ✅ Alert triggers again
(Same logic applies for RSI < 20 → 🔴 Bearish zone)
⚙️ How to Add Alerts on TradingView (Step-by-Step)
Apply the indicator to your chart:
🔍 Search: Emperor RSI Candle → Add to chart
Click on the 🔔 Alert icon at the top of TradingView
In the "Condition" dropdown, select:
Emperor RSI Candle → Any alert() function call
Choose Your Candle Timeframe
Choose your preferred alert method (popup, app, SMS, email, webhook)
Click “Create”
You’ll now get automated alerts as soon as RSI gives the first close in extreme bullish or bearish zones.
🎯 Combine this with the Emperor Pivot for next-level clarity.
“Setup Aisa KI — Trading Simple, Success Double!”
The Emperor RSI Candle indicator is now even more powerful for scalpers and high-frequency traders.
🔧 New Feature:
✅ 30-Second Timeframe support is now available
→ Toggle it in the settings under Timeframe Selection
→ Visualizes RSI-based candle signals at ultra-low intervals
The latest update to the Emperor Candle script introduces a powerful HTF Candle Overlay system, giving traders a multi-timeframe visual edge directly on their current chart. This addition helps identify significant institutional zones, liquidity areas, and HTF momentum without switching charts.
🔧 Feature Overview
✅ HTF Selection (HTF 1–6)
Enable/Disable up to 6 HTFs for overlay visualization.
Choose from standard timeframes (15m, 1h, 3h, 6h, 12h, 1D).
Each HTF has a dedicated candle count input, allowing control over how many historical HTF candles to display.
Example: Show last 12 candles of 15min HTF and last 24 candles of 1hr HTF while skipping others.
⚙️ Settings Breakdown
📌 Limit to Next HTFs Only
When checked, only HTFs directly above the chart’s timeframe will be shown (prevents clutter).
📅 Custom Daily Candle Open
Allows setting a custom start time for daily candles (e.g., Midnight, New York Open, etc.).
⚖️ Bias
Set the directional bias (Neutral, Bullish, Bearish) to color-code or filter certain visuals.
🖌️ Styling Options
📦 Candle Customization
Customize Body, Borders, and Wick colors for bullish and bearish candles.
Maintain consistent multi-timeframe visibility.
📏 Spacing & Width
Control the distance between current and HTF candles, between candles themselves, and candle width.
🏷️ HTF Label Settings
Label Display
Show HTF labels with adjustable position (Top, Bottom, Both) and alignment (Follow Candle, Static).
Show remaining time for the current HTF candle close.
Interval Value option to display the HTF timeframe on labels.
🧭 Trace Lines
Open, High, Low, Close levels of HTF candles can be traced.
Customize line style, width, and opacity.
Choose which candle (e.g., first visible, latest) to anchor trace lines to.
Useful for marking key HTF levels and reacting to price respecting or breaking them.
🪜 Separator & Structure Tools
HTF Separators
Visual horizontal lines marking HTF structure.
Adjustable color, style (Dotted, Dashed, Solid), width, and timeframe to use.
Helpful for identifying session or HTF candle boundaries.
🧠 Smart Features
🧭 Sweep Detection
Option to show liquidity sweep zones via Show Sweeps and alert on detection.
Great for spotting stop hunts or liquidity grabs.
📉 Imbalance Zones (Future Update-Ready)
Fair Value Gap and Volume Imbalance zones planned with toggles and customizable appearance.
📈 Ideal Use Cases
Identify HTF Supply/Demand zones.
Spot confluence of multiple HTF wicks or bodies near a level.
Overlay institutional candles (like 12h, 1D) while trading on intraday (1m, 5m) timeframes.
Use trace lines to monitor HTF breakout/pullback behavior.
Set bias direction to help automate filters and setups.
🧩 Compatible With
Emperor Candle’s existing RSI and Breakout Logic.
Divergence visualization.
Pivot overlays and custom candle logic.
Take your charting to the next level with the latest update of the Emperor Candle indicator — now equipped with RSI-based trend detection, an extended list of custom candlestick patterns, and fine-tuned control over shadow and body interpretation.
🔧 What’s New in This Update?
📈 RSI-Based Trend Detection (Dynamic Mode)
You can now choose to detect trend context based on RSI Zones, replacing traditional SMA-based logic.
RSI > 60 → Bullish
RSI > 80 → Extreme Bullish
RSI between 40–60 → Neutral
RSI < 40 → Bearish
RSI < 20 → Extreme Bearish
This helps filter out false signals and improves the relevance of candle patterns by reading market momentum.
🕯️ Enhanced Candlestick Pattern Engine
You now have complete control over which candle patterns to display, including:
✅ Hammer
✅ Inverted Hammer
🟫 Doji, Engulfing, Morning Star, Evening Star, Shooting Star, Marubozu, Harami, Three Soldiers, Tasuki Gap, and many more!
Simply enable or disable them using the checkboxes in the settings panel to tailor the pattern detection to your strategy.
🧠 Smart Body & Shadow Calculations
We use adaptive thresholds (based on EMA of body size and percentage-based shadow filters) to classify candle types:
Small vs Long body
Doji detection
Shadow dominance and equality
Inside bar and body midpoint tracking
This ensures high-quality pattern recognition without flooding your chart with noise.
🎨 Visual Customization
Set label colors separately for bullish, bearish, and neutral signals.
Toggle display of patterns using dropdowns (Bullish, Bearish, Both).
Candlestick detection respects your chosen trend context (SMA or RSI).
⚙️ Trend Detection Modes Available
You can choose between:
SMA20 to SMA1440 (12 options)
RSI Zone Logic
Or disable trend detection entirely ("No Detection")
Trend detection is used to filter pattern signals based on the market’s directional bias.
💡 Use Case Examples
Show Inverted Hammer only during bearish RSI zone
Plot Hammer only when RSI < 40 and price reverses with confirmation
Combine SMA trend + RSI confirmation for dual-filter strategy
🪄 Summary of Features
✅ RSI-based trend logic
✅ Full candlestick pattern library with on/off switches
✅ ATR-based dynamic label positioning
✅ Customizable colors for clarity
✅ Fine-grained control over candle anatomy (shadows, body size, doji rules)
✅ Multiple trend detection strategies (SMA or RSI or none)
-19 min
-38min
-2 Day
-3 Day
-4 Day
This update refines the Multi-Timeframe VWAP engine by removing redundant and unused higher-timeframe options, specifically the 3-Day and 4-Day intervals. These timeframes are rarely used in active intraday or swing trading workflows, and eliminating them helps streamline the overall indicator configuration.
What’s Improved
Removed 3D & 4D timeframes from:
User input menu
Internal timeframe array mapping
Display/label conversion system
Timeframe count reduced from 31 → 29, improving loading efficiency.
Ensured all index numbering remains fully aligned to prevent array mismatches.
UI is now cleaner, avoiding confusion with similar higher-TF pivots and VWAP calculations.
Why This Change Matters
Traders can scroll less and select more relevant intraday or HTF VWAPs quickly.
Script performance improves slightly due to a smaller array footprint.
Long-term maintainability becomes smoother, with fewer unused branches in the mapping logic.
Impact
No changes to:
VWAP calculations
Pivot logic
Candle pattern alerts
MTF tables
All existing features remain fully functional.
No changes to:
VWAP calculations
Pivot logic
Candle pattern alerts
MTF tables
This update focuses on improving clarity and consistency across the indicator by updating the names of several timeframe inputs and their corresponding display labels. The goal is to make the interface more intuitive and easier to navigate, especially for traders who frequently switch between multiple VWAP timeframes.
What’s New
Timeframe names updated for better readability
Short numeric values (e.g., 60, 120, 180) now display in a more user-friendly way such as 1Hour, 2Hour, 3Hour, etc.
Consistent formatting across all timeframe labels
Every timeframe now follows a uniform style:
"Min" for minute-based frames
"Hour" for hourly frames
"Daily", "Weekly", "Monthly", etc. for higher TFs
Removed unused 3-Day & 4-Day timeframes
This reduces clutter and streamlines the selection panel.
Aligned input menu names with updated tfDisplay labels
Ensures the UI and table outputs now match exactly.
Improved internal mapping structure
All changes synced across:
Input section
Timeframe arrays
Display conversion switch-block
Why This Matters
Cleaner naming = faster decision-making when selecting TF VWAPs.
Removes unnecessary confusion caused by shorthand numbers.
More professional and uniform presentation for advanced users.
Enhances script maintainability going forward.
Impact
This update does not modify any calculations, VWAP values, pivot logic, or alert behavior.
All renaming changes are cosmetic and UI-oriented.
Script su invito
Solo gli utenti approvati dall'autore possono accedere a questo script. È necessario richiedere e ottenere l'autorizzazione per utilizzarlo. Tale autorizzazione viene solitamente concessa dopo il pagamento. Per ulteriori dettagli, seguire le istruzioni dell'autore riportate di seguito o contattare direttamente LiveTradingEmperor.
TradingView NON consiglia di acquistare o utilizzare uno script a meno che non si abbia piena fiducia nel suo autore e se ne comprenda il funzionamento. È inoltre possibile trovare alternative gratuite e open source nei nostri script della community.
Istruzioni dell'autore
Declinazione di responsabilità
Script su invito
Solo gli utenti approvati dall'autore possono accedere a questo script. È necessario richiedere e ottenere l'autorizzazione per utilizzarlo. Tale autorizzazione viene solitamente concessa dopo il pagamento. Per ulteriori dettagli, seguire le istruzioni dell'autore riportate di seguito o contattare direttamente LiveTradingEmperor.
TradingView NON consiglia di acquistare o utilizzare uno script a meno che non si abbia piena fiducia nel suo autore e se ne comprenda il funzionamento. È inoltre possibile trovare alternative gratuite e open source nei nostri script della community.