OPEN-SOURCE SCRIPT
Aggiornato Kalman Filter by Tenozen
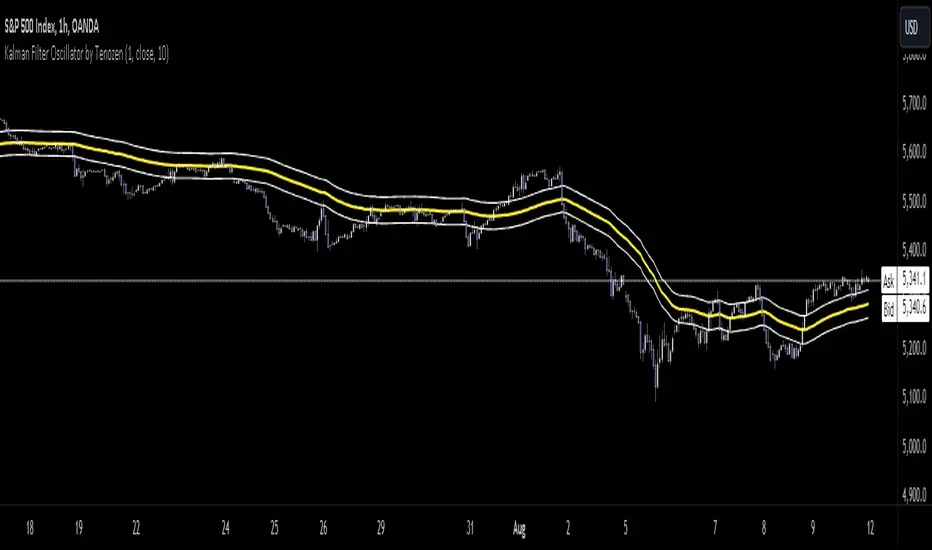
Another useful indicator is here! Kalman Filter is a quantitative tool created by Rudolf E. Kalman. In the case of trading, it can help smooth out the price data that traders observe, making it easier to identify underlying trends. The Kalman Filter is particularly useful for handling price data that is noisy and unpredictable. As an adaptive-based algorithm, it can easily adjust to new data, which makes it a handy tool for traders operating in markets that are prone to change quickly.
Many people may assume that the Kalman Filter is the same as a Moving Average, but that is not the case. While both tools aim to smooth data and find trends, they serve different purposes and have their own sets of advantages and disadvantages. The Kalman Filter provides a more dynamic and adaptive approach, making it suitable for real-time analysis and predictive capabilities, but it is also more complex. On the other hand, Moving Averages offer a simpler and more intuitive way to visualize trends, which makes them a popular choice among traders for technical analysis. However, the Moving Average is a lagging indicator and less adaptive to market change, if it's adjusted it may result in overfitting. In this case, the Kalman Filter would be a better choice for smoothing the price up.
I hope you find this indicator useful! It's been an exciting and extensive journey since I began diving into the world of finance and trading. I'll keep you all updated on any new indicators I discover that could benefit the community in the future. Until then, take care, and happy trading! Ciao.
Note di rilascio
Update: New type added, "Timeframe". Reset calculation every x timeframe.Note di rilascio
Update:- TF option removed, as it is better to adjust by "length"
- Length option added, now you can adjust it according to your preferences. The higher the length, the higher the sensitivity would be towards the market.
Note di rilascio
Percentile range added. Example usage: If the price exceeds the 10th percentile range, the market tends to trend, and if the market is in the 10th percentile range, the market is closer to random.Note di rilascio
...Script open-source
In pieno spirito TradingView, il creatore di questo script lo ha reso open-source, in modo che i trader possano esaminarlo e verificarne la funzionalità. Complimenti all'autore! Sebbene sia possibile utilizzarlo gratuitamente, ricorda che la ripubblicazione del codice è soggetta al nostro Regolamento.
Declinazione di responsabilità
Le informazioni ed i contenuti pubblicati non costituiscono in alcun modo una sollecitazione ad investire o ad operare nei mercati finanziari. Non sono inoltre fornite o supportate da TradingView. Maggiori dettagli nelle Condizioni d'uso.
Script open-source
In pieno spirito TradingView, il creatore di questo script lo ha reso open-source, in modo che i trader possano esaminarlo e verificarne la funzionalità. Complimenti all'autore! Sebbene sia possibile utilizzarlo gratuitamente, ricorda che la ripubblicazione del codice è soggetta al nostro Regolamento.
Declinazione di responsabilità
Le informazioni ed i contenuti pubblicati non costituiscono in alcun modo una sollecitazione ad investire o ad operare nei mercati finanziari. Non sono inoltre fornite o supportate da TradingView. Maggiori dettagli nelle Condizioni d'uso.