OPEN-SOURCE SCRIPT
Aggiornato Pi Cycle MACD Inverse Oscillator
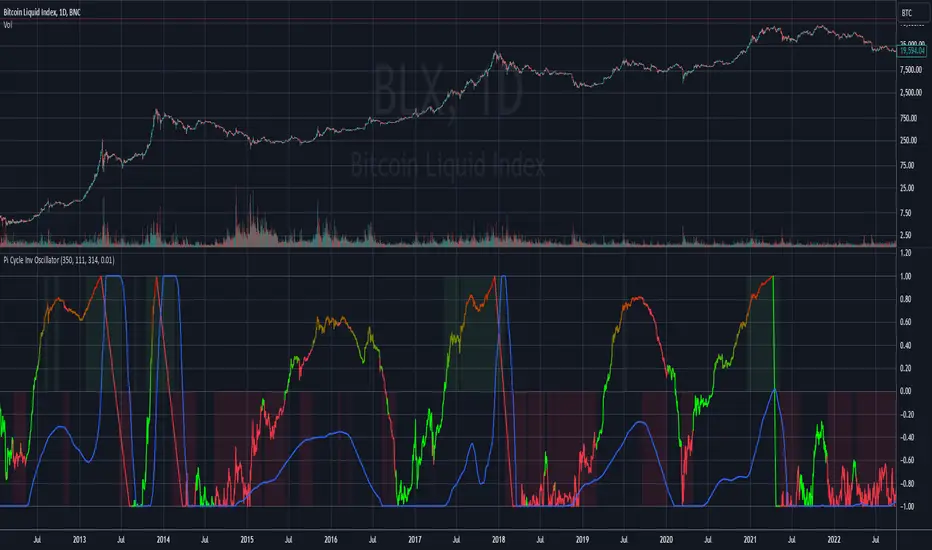
Pi Cycle MACD Inverse Oscillator with Gradient and Days Since Last Top
This indicator is ideal for Bitcoin traders seeking a robust tool to visualize long-term and short-term trends with enhanced clarity and actionable insights.
This script combines the concept of the Pi Cycle indicator with a unique MACD-based inverse oscillator to analyze Bitcoin market trends. It introduces several features to help traders understand market conditions better:
Inverse Oscillator:
- Oscillator ranges between 1 and -1.
- A value of 1 indicates the two moving averages (350 MA and 111 MA) are equal.
- A value of -1 indicates the maximum observed distance between the moving averages during the selected lookback period.
- The oscillator dynamically adjusts to price changes using a configurable scaling factor.
Gradient Visualization:
The oscillator line transitions smoothly from green (closer to -1) to yellow (at 0) and red (closer to 1).
The color gradient provides a quick visual cue for market momentum.
Days Since Last Pi Cycle Top:
Calculates and displays the number of days since the last "Pi Cycle Top" (defined as a crossover between the two moving averages).
The label updates dynamically and appears only on the most recent bar.
Conditional Fill:
Highlights the area between 0 and 1 with a green gradient when the price is above the long moving average.
Enhances visual understanding of the oscillator's position relative to key thresholds.
Inputs:
- Long Moving Average (350 default): Determines the primary trend.
- Short Moving Average (111 default): Measures shorter-term momentum.
- Oscillator Lookback Period (100 default): Defines the range for normalizing the oscillator.
- Price Scaling Factor (0.01 default): Adjusts the normalization to account for large price fluctuations.
How to Use:
- Use the oscillator to identify potential reversal points and trend momentum.
- Look for transitions in the gradient color and the position relative to 0.
- Monitor the "Days Since Last Top" label for insights into the market's cycle timing.
- Utilize the conditional fill to quickly assess when the market is in a favorable position above the long moving average.
Note di rilascio
set default lookback period 314 daysNote di rilascio
set background colour to:- green if the price is abovethe long MA
- orange if price is between the short and long moving averages
- red if the price is below the short MA
Note di rilascio
Fixed time series to daily so the oscilator works on any time frameNote di rilascio
Added parameter "Use Fixed BLX Bitcoin Ticker?" to allow either using the currency pair of the current chart in the oscilator calculations, or use the BLX bitcoin ticker in the oscillator calculations regardles of the current chart currenty pair.Note di rilascio
added optional Normalized MA Distance plotThe Normalized Moving Average Distance provides a scaled comparison of the relative difference between the short and long moving averages (MAs) on the same oscillator scale (-1 to 1). By normalizing the MA distance, the script allows traders to observe the dynamic relationship between the MAs regardless of price level, highlighting trends and shifts more effectively. This is especially useful for spotting changes in momentum and identifying key convergence or divergence points in the market. The normalization ensures consistency across different assets or timeframes, making it a versatile tool for technical analysis.
Script open-source
Nello spirito di TradingView, l'autore di questo script lo ha reso open source, in modo che i trader possano esaminarne e verificarne la funzionalità. Complimenti all'autore! Sebbene sia possibile utilizzarlo gratuitamente, ricordiamo che la ripubblicazione del codice è soggetta al nostro Regolamento.
Declinazione di responsabilità
Le informazioni e le pubblicazioni non sono intese come, e non costituiscono, consulenza o raccomandazioni finanziarie, di investimento, di trading o di altro tipo fornite o approvate da TradingView. Per ulteriori informazioni, consultare i Termini di utilizzo.