OPEN-SOURCE SCRIPT
Aggiornato RSI Overbought/Oversold [Overlay Highlighter]

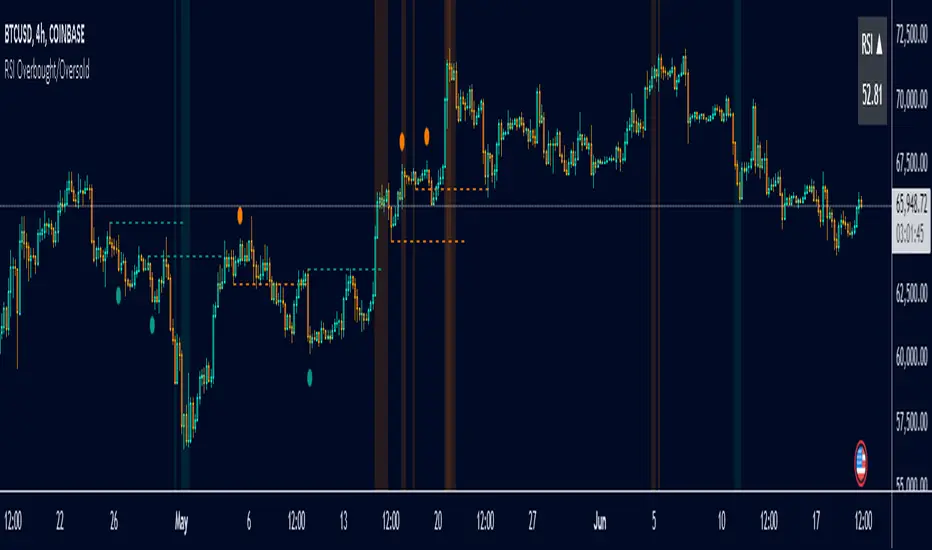
Indicator to show when the RSI is in oversold(Below 30) or overbought (Above 70) conditions. The background color of the chart changes colors in the areas where the above conditions are met.
Price can often reverse in these areas. However, this depends on the strength of the trend and price may continue higher or lower in the direction of the overall trend.
Divergence has been added to aid the user in timing reversals. Divergences are plotted by circles above or below the candles. Divergence is confirmed so there is a delay of one candle before the signal is given on the previous candle. Again, everything depends on the strength of the trend so use proper risk management.
Once the RSI has entered into oversold/overbought conditions, it is recommended to wait for divergence before entering into the trade near areas of support or resistance. It is recommended to utilize this strategy on the H4 timeframe, however, this particular strategy works on all timeframes.
This indicator is a modified version of seoco's RSI Overbought/Oversold + Divergence Indicator. The user interface has been refined, is now overlayed on the chart, and my own divergence code has been inserted.
Note di rilascio
Refined table- adjusted table locations
- adjusted color to change based on oversold/overbought conditions
Added lines
- lines will be plotted where rsi divergence signals
- alert condition for deviation of lines
Cleaned up UI
Note di rilascio
- added William's Fractals to allow user to see support/resistance once divergence is triggered
- support/resistance dashed line will show at previous fractal; allows user see target to confirm divergence.
- support broken = bearish div confirmed; resistance broken = bullish div confirmed
- added rsi momentum in table
- up triangle = bullish mom; down triangle = bearish mom
- added alert functions; ensure you delete alert message when setting them
Note di rilascio
- Updated alert functions
Script open-source
In pieno spirito TradingView, il creatore di questo script lo ha reso open-source, in modo che i trader possano esaminarlo e verificarne la funzionalità. Complimenti all'autore! Sebbene sia possibile utilizzarlo gratuitamente, ricorda che la ripubblicazione del codice è soggetta al nostro Regolamento.
Declinazione di responsabilità
Le informazioni ed i contenuti pubblicati non costituiscono in alcun modo una sollecitazione ad investire o ad operare nei mercati finanziari. Non sono inoltre fornite o supportate da TradingView. Maggiori dettagli nelle Condizioni d'uso.