OPEN-SOURCE SCRIPT
Aggiornato Stochastic RSI Heat Candles Overlay
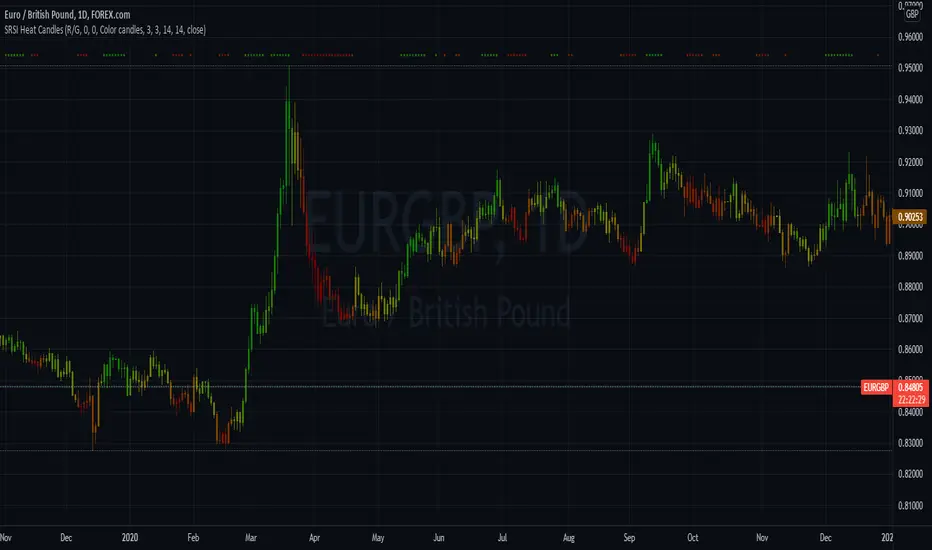
This script is based on the Stochastic RSI indicator.
Candles are dynamically colored with a customizable RGB shading directly generated from the average Stochastic RSI current value.
By default, colors represent the following status -> green is overgought & red is oversold.
Options:
Examples:


Notes:
Candles are dynamically colored with a customizable RGB shading directly generated from the average Stochastic RSI current value.
By default, colors represent the following status -> green is overgought & red is oversold.
Options:
- Shading colors: Choose between Red/Green, Green/Blue, and Blue/Red shadings to represent the SRSI heat.
- Invert colors: Switch colors of the selected shading.
- Third color: Select a value from 0 to 255 for the third color which does not vary.
- Transparency: Select the transparency value.
- Overlay style : Choose to color the whole candle, or only borders and wick.
- Show candle side: If you choose to fully fill candles with the SRSI heat color , enable this option to plot shapes representing the candles directions.
- Candle marks colors: Select bull and bear colors for direction shapes.
- Overbought and Oversold situations are also represented by colored shapes at the top of the chart.
- Standards Stochastic RSI parameters.
Examples:
Notes:
- Do not forget to bring the script to the front of your chart to avoid being covered by default candles.
- Next improvements would probably be a better coloring algorithm, however, do not hesitate to suggest any modifications in comments.
- Initially, I shared a Stochastic RSI Heat Bollinger Bands indicator which gave me the idea to develop this one, you can find it on my profile.
Note di rilascio
Useless lines removedScript open-source
In pieno spirito TradingView, il creatore di questo script lo ha reso open-source, in modo che i trader possano esaminarlo e verificarne la funzionalità. Complimenti all'autore! Sebbene sia possibile utilizzarlo gratuitamente, ricorda che la ripubblicazione del codice è soggetta al nostro Regolamento.
Declinazione di responsabilità
Le informazioni ed i contenuti pubblicati non costituiscono in alcun modo una sollecitazione ad investire o ad operare nei mercati finanziari. Non sono inoltre fornite o supportate da TradingView. Maggiori dettagli nelle Condizioni d'uso.
Script open-source
In pieno spirito TradingView, il creatore di questo script lo ha reso open-source, in modo che i trader possano esaminarlo e verificarne la funzionalità. Complimenti all'autore! Sebbene sia possibile utilizzarlo gratuitamente, ricorda che la ripubblicazione del codice è soggetta al nostro Regolamento.
Declinazione di responsabilità
Le informazioni ed i contenuti pubblicati non costituiscono in alcun modo una sollecitazione ad investire o ad operare nei mercati finanziari. Non sono inoltre fornite o supportate da TradingView. Maggiori dettagli nelle Condizioni d'uso.