OPEN-SOURCE SCRIPT
Aggiornato [blackcat] L3 Aroon Zone
Level 3
Background
The Aroon indicator developed by Tushar Chanand indicates whether there is a trend price or is located in a trading area.
Function
Classical Aroon can also show the beginning of a new trend, its strength and expectation of changes from trade areas to trends. However, it produces too much noise when is bull or bear during sideways. In this improved version, I use bars without "blur cross" to classify bull, bear and sideways, which could look better to know the status of current market.
Since Chinese uses red for bull, green for bear, while others use green for bull and red for bear, i try to avoid to use red or green, which may be confusing. I use my style of color for bull and bear:
Yellow --> Bull
Fuchsia --> Bear
Gray --> Sideways
Remarks
Feedbacks are appreciated.
Note di rilascio
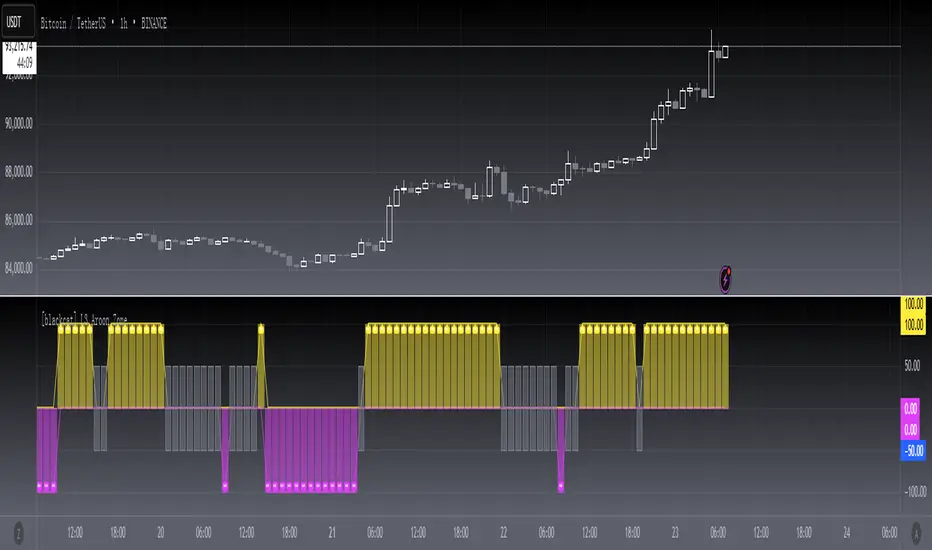
OVERVIEWThe [blackcat] L3 Aroon Zone indicator helps traders identify potential buy and sell opportunities using the Aroon oscillator. By calculating Aroon Up and Aroon Down values, this indicator determines zones of bullish and bearish strength, plotting them clearly on the chart. It also identifies periods of market choppiness, providing a comprehensive view of market conditions 📊💹.
FEATURES
Calculates Aroon Up and Aroon Down values based on user-defined length:
Default length: 14 bars.
Determines bullish and bearish signals based on Aroon values:
Bullish Signal: Yellow line and column when Aroon Up > 70 and Aroon Down < 70.
Bearish Signal: Fuchsia line and column when Aroon Down > 70 and Aroon Up < 70.
Identifies choppy market conditions where neither bullish nor bearish signals are present:
Gray candlesticks indicate choppiness.
Plots clear labels on the chart for quick identification of trade signals:
"Buy" labeled in yellow at potential buy points.
"Sell" labeled in fuchsia at potential sell points.
Generates alerts for both buy and sell signals 🔔
HOW TO USE
Add the indicator to your TradingView chart by selecting it from the indicators list.
Adjust the Aroon Length parameter to suit your preferred sensitivity ⚙️.
Monitor the chart for bullish and bearish columns indicating potential trade opportunities.
Observe gray candlesticks to identify choppy market conditions.
Set up alerts based on the generated signals to receive notifications when conditions are met 📲.
Combine this indicator with other tools for confirmation before making trading decisions.
LIMITATIONS
The indicator may generate false signals in highly volatile or ranging markets 🌪️.
Users should always confirm signals with other forms of analysis.
The effectiveness of the indicator may vary depending on the asset and timeframe being analyzed.
NOTES
Ensure that you have sufficient historical data available for accurate calculations.
Test the indicator thoroughly on demo accounts before applying it to live trading 🔍.
Customize the appearance and parameters as needed to fit your trading strategy.
Script open-source
Nello spirito di TradingView, l'autore di questo script lo ha reso open source, in modo che i trader possano esaminarne e verificarne la funzionalità. Complimenti all'autore! Sebbene sia possibile utilizzarlo gratuitamente, ricordiamo che la ripubblicazione del codice è soggetta al nostro Regolamento.
Avoid losing contact!Don't miss out! The first and most important thing to do is to join my Discord chat now! Click here to start your adventure: discord.com/invite/ZTGpQJq 防止失联,请立即行动,加入本猫聊天群: discord.com/invite/ZTGpQJq
Declinazione di responsabilità
Le informazioni e le pubblicazioni non sono intese come, e non costituiscono, consulenza o raccomandazioni finanziarie, di investimento, di trading o di altro tipo fornite o approvate da TradingView. Per ulteriori informazioni, consultare i Termini di utilizzo.