OPEN-SOURCE SCRIPT
Quarterly Rolling VWAP
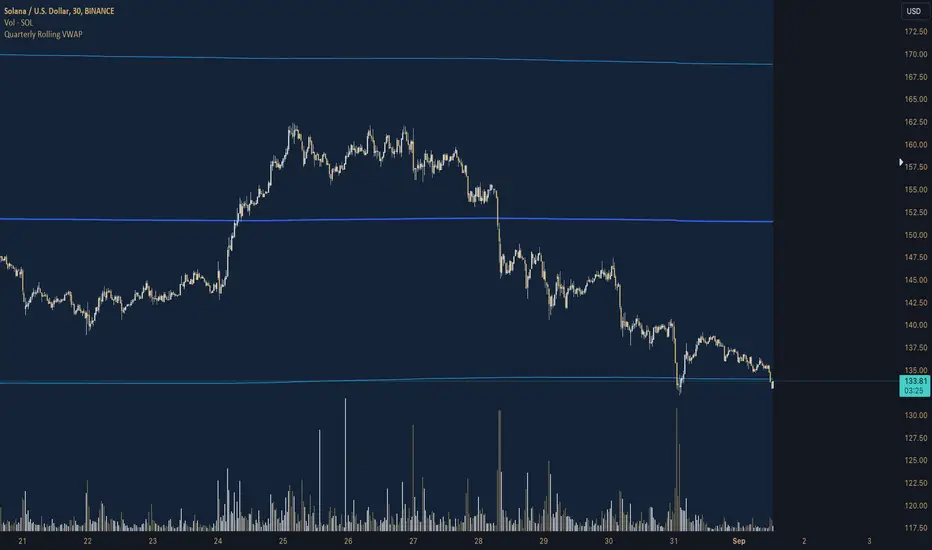
# Quarterly Rolling VWAP Indicator
This custom indicator calculates and displays a Volume-Weighted Average Price (VWAP) that resets at the beginning of each quarter, providing traders with a medium-term perspective on price action relative to trading volume.
## Key Features:
1. **Quarterly Reset**: The VWAP calculation automatically resets at the beginning of each quarter, allowing for a rolling analysis that adapts to changing market conditions.
2. **Standard Deviation Bands**: The indicator includes two sets of bands based on standard deviations from the VWAP, helping to identify potential support and resistance levels.
3. **Customizable Appearance**: Users can adjust the colors of the VWAP line and bands, as well as control the visibility and transparency of the bands.
4. **Flexible Band Multipliers**: The distance of the bands from the VWAP can be adjusted using customizable multipliers.
## Indicator Logic:
1. **Quarterly Detection**:
- The script uses a function `isNewQuarter()` to determine the start of a new quarter.
- It calculates the timestamp for the start of the current quarter and checks for changes in this value.
2. **VWAP Calculation**:
- The `calcVWAP()` function computes the Volume-Weighted Average Price.
- It maintains running sums of price * volume and volume, which reset at the start of each quarter.
- The VWAP is calculated as the ratio of these sums.
3. **Standard Deviation Calculation**:
- The `calcStdDev()` function computes the standard deviation of price from the VWAP.
- It uses a similar approach to VWAP, maintaining running sums that reset quarterly.
4. **Band Calculation**:
- Two sets of bands are calculated using the VWAP, standard deviation, and user-defined multipliers.
- Upper and lower bands are plotted at 1x and 2x the standard deviation by default, but these are customizable.
5. **Plotting**:
- The main VWAP line is plotted with user-defined color and width.
- Bands are plotted conditionally based on user preference.
- The area between bands is filled with a semi-transparent color for better visualization.
## Trading Applications:
- **Medium-Term Trend Analysis**: The quarterly VWAP provides a broader perspective on price trends compared to daily or weekly VWAPs.
- **Support and Resistance**: The VWAP line and bands can act as dynamic support and resistance levels.
- **Mean Reversion Strategies**: Traders can look for potential reversals when price reaches the outer bands.
- **Volatility Assessment**: The width of the bands gives an indication of recent price volatility relative to volume.
- **Quarter-over-Quarter Comparison**: By resetting each quarter, the indicator allows for easy comparison of price action across different quarters.
This Quarterly Rolling VWAP indicator is particularly useful for traders focusing on medium-term strategies or those who want to incorporate a broader market context into their analysis. It combines the power of volume-weighted pricing with a quarterly perspective, offering a unique tool for technical analysis
Script open-source
Nello spirito di TradingView, l'autore di questo script lo ha reso open source, in modo che i trader possano esaminarne e verificarne la funzionalità. Complimenti all'autore! Sebbene sia possibile utilizzarlo gratuitamente, ricordiamo che la ripubblicazione del codice è soggetta al nostro Regolamento.
Declinazione di responsabilità
Le informazioni e le pubblicazioni non sono intese come, e non costituiscono, consulenza o raccomandazioni finanziarie, di investimento, di trading o di altro tipo fornite o approvate da TradingView. Per ulteriori informazioni, consultare i Termini di utilizzo.