PROTECTED SOURCE SCRIPT
Dynamic Fib 61.8
Dynamic Fib 61.8 Indicator – Full Guide
1. Overview
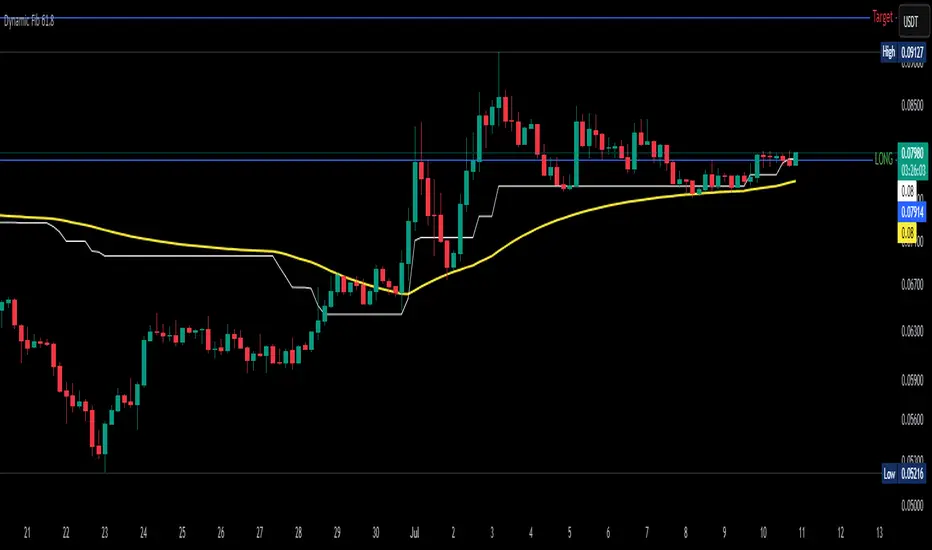
This indicator plots a dynamic 61.8% Fibonacci retracement level, adjusted for market volatility and smoothed using an EMA for cleaner signals. Unlike traditional static Fib levels, this version auto-adjusts based on recent price swings, making it more responsive to changing market conditions.
Key Features:
✅ Auto-Adjusting 61.8% Fib Level – Adapts to the highest high/lowest low over a user-defined period.
✅ EMA Smoothing – Reduces noise for more reliable support/resistance.
✅ Breakout Alerts – Built-in alerts for when price crosses the Fib level.
✅ Inverse Chart Support – Works on both regular and inverse price scales.
2. How to Use This Indicator
Primary Use Case:
Trend Retracement Entry: The 61.8% level often acts as a reversal zone in trending markets.
Breakout Confirmation: A decisive close above/below the smoothed Fib level suggests trend continuation.
Support/Resistance Flip: Watch for price reactions at this level for intraday/swing trades.
Input Parameters:
Input Default Description
Lookback Period 52 Determines how far back the highest high/lowest low is calculated. Higher = slower reaction, lower = more sensitive.
EMA Smoothing 3 Controls how much the Fib level is smoothed (higher = smoother but laggier).
Invert Price Scale Off Flips the calculation for inverse charts (e.g., for crypto perpetuals).
3. Interpretation & Trading Rules
Bullish Scenario (Buy Dips):
Price retraces to the smoothed Fib 61.8 level in an uptrend.
Confirmation: Wait for bullish candlestick patterns (hammer, engulfing) or RSI > 50.
Entry: Long on a bounce, stop-loss below recent swing low.
Bearish Scenario (Sell Rallies):
Price retraces to the smoothed Fib 61.8 level in a downtrend.
Confirmation: Bearish rejection (shooting star, bearish engulfing) or RSI < 50.
Entry: Short on rejection, stop-loss above recent swing high.
Breakout Trading:
If price closes decisively above/below the smoothed Fib level, it may signal trend continuation.
Volume & Momentum Confirmation: Use with MACD/RSI for stronger signals.
4. Best Confluence Indicators
This indicator works best when combined with:
A. Momentum Oscillators
RSI (14):
Look for oversold (RSI < 30) near Fib support in uptrends.
Look for overbought (RSI > 70) near Fib resistance in downtrends.
MACD:
Bullish: MACD crossing above signal line near Fib support.
Bearish: MACD crossing below signal line near Fib resistance.
B. Volume Analysis
Volume Spike + Fib Bounce = Strong Reversal Signal
Low Volume at Fib Retest = Potential Fakeout
C. Moving Averages
50 EMA/200 EMA Alignment:
If price is above 200 EMA and retests Fib 61.8, it’s a high-probability long.
If price is below 200 EMA and rejects Fib 61.8, it’s a high-probability short.
D. Price Action Patterns
Engulfing, Pin Bars, Inside Bars at the Fib level add confirmation.
5. Example Strategy
Setup:
Trend Identification – Price is above 200 EMA (uptrend).
Retracement to Smoothed Fib 61.8 – Price pulls back to the dynamic level.
Confirmation – Bullish hammer forms + RSI > 50.
Entry – Buy with stop below recent swing low.
Target – Previous high or 1.618 Fib extension.
6. Limitations & Adjustments
Choppy Markets: The Fib level may give false signals (use ATR filter).
Optimal Period Adjustment:
For day trading, reduce Lookback Period (e.g., 20-30).
For swing trading, increase (e.g., 50-100).
EMA Smoothing: If too slow, increase smoothing to 5-10.
Final Thoughts
This indicator is best used as a dynamic support/resistance tool rather than a standalone system. Combining it with momentum filters, volume, and price action significantly improves accuracy.
1. Overview
This indicator plots a dynamic 61.8% Fibonacci retracement level, adjusted for market volatility and smoothed using an EMA for cleaner signals. Unlike traditional static Fib levels, this version auto-adjusts based on recent price swings, making it more responsive to changing market conditions.
Key Features:
✅ Auto-Adjusting 61.8% Fib Level – Adapts to the highest high/lowest low over a user-defined period.
✅ EMA Smoothing – Reduces noise for more reliable support/resistance.
✅ Breakout Alerts – Built-in alerts for when price crosses the Fib level.
✅ Inverse Chart Support – Works on both regular and inverse price scales.
2. How to Use This Indicator
Primary Use Case:
Trend Retracement Entry: The 61.8% level often acts as a reversal zone in trending markets.
Breakout Confirmation: A decisive close above/below the smoothed Fib level suggests trend continuation.
Support/Resistance Flip: Watch for price reactions at this level for intraday/swing trades.
Input Parameters:
Input Default Description
Lookback Period 52 Determines how far back the highest high/lowest low is calculated. Higher = slower reaction, lower = more sensitive.
EMA Smoothing 3 Controls how much the Fib level is smoothed (higher = smoother but laggier).
Invert Price Scale Off Flips the calculation for inverse charts (e.g., for crypto perpetuals).
3. Interpretation & Trading Rules
Bullish Scenario (Buy Dips):
Price retraces to the smoothed Fib 61.8 level in an uptrend.
Confirmation: Wait for bullish candlestick patterns (hammer, engulfing) or RSI > 50.
Entry: Long on a bounce, stop-loss below recent swing low.
Bearish Scenario (Sell Rallies):
Price retraces to the smoothed Fib 61.8 level in a downtrend.
Confirmation: Bearish rejection (shooting star, bearish engulfing) or RSI < 50.
Entry: Short on rejection, stop-loss above recent swing high.
Breakout Trading:
If price closes decisively above/below the smoothed Fib level, it may signal trend continuation.
Volume & Momentum Confirmation: Use with MACD/RSI for stronger signals.
4. Best Confluence Indicators
This indicator works best when combined with:
A. Momentum Oscillators
RSI (14):
Look for oversold (RSI < 30) near Fib support in uptrends.
Look for overbought (RSI > 70) near Fib resistance in downtrends.
MACD:
Bullish: MACD crossing above signal line near Fib support.
Bearish: MACD crossing below signal line near Fib resistance.
B. Volume Analysis
Volume Spike + Fib Bounce = Strong Reversal Signal
Low Volume at Fib Retest = Potential Fakeout
C. Moving Averages
50 EMA/200 EMA Alignment:
If price is above 200 EMA and retests Fib 61.8, it’s a high-probability long.
If price is below 200 EMA and rejects Fib 61.8, it’s a high-probability short.
D. Price Action Patterns
Engulfing, Pin Bars, Inside Bars at the Fib level add confirmation.
5. Example Strategy
Setup:
Trend Identification – Price is above 200 EMA (uptrend).
Retracement to Smoothed Fib 61.8 – Price pulls back to the dynamic level.
Confirmation – Bullish hammer forms + RSI > 50.
Entry – Buy with stop below recent swing low.
Target – Previous high or 1.618 Fib extension.
6. Limitations & Adjustments
Choppy Markets: The Fib level may give false signals (use ATR filter).
Optimal Period Adjustment:
For day trading, reduce Lookback Period (e.g., 20-30).
For swing trading, increase (e.g., 50-100).
EMA Smoothing: If too slow, increase smoothing to 5-10.
Final Thoughts
This indicator is best used as a dynamic support/resistance tool rather than a standalone system. Combining it with momentum filters, volume, and price action significantly improves accuracy.
Script protetto
Questo script è pubblicato come codice protetto. Tuttavia, è possibile utilizzarle liberamente e senza alcuna limitazione – ulteriori informazioni qui.
Declinazione di responsabilità
Le informazioni e le pubblicazioni non sono intese come, e non costituiscono, consulenza o raccomandazioni finanziarie, di investimento, di trading o di altro tipo fornite o approvate da TradingView. Per ulteriori informazioni, consultare i Termini di utilizzo.