PROTECTED SOURCE SCRIPT
Aggiornato Liquidity Trend System
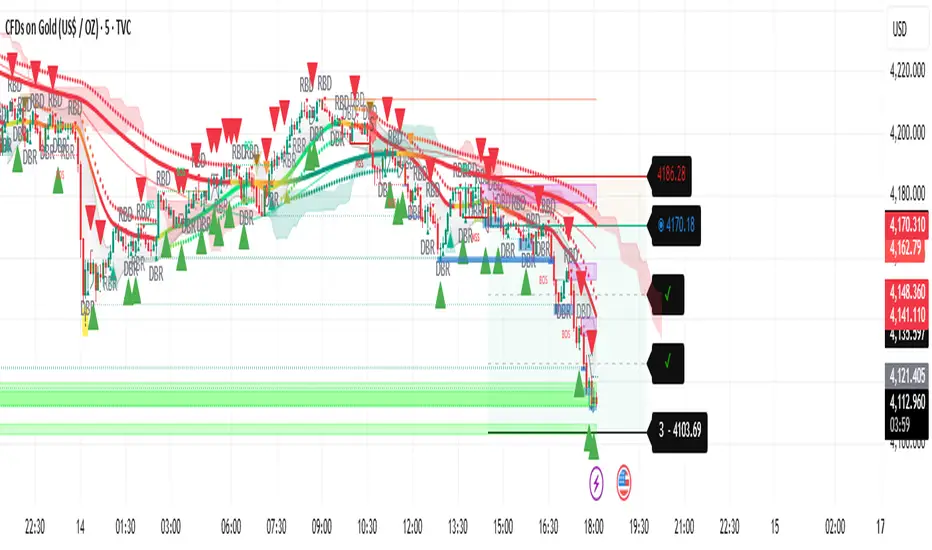
This script is a multi-strategy trading indicator. It combines several technical analysis tools into one overlay indicator to generate Buy and Sell signals. Here’s what it does:
✅ Main Purpose
It analyses price action and trends using multiple methods and plots signals, targets, and alerts on the chart. The goal is to identify high-probability trade setups.
🔍 Components & Their Roles
Target Trend
Detects trend direction using moving averages and ATR.
Draws stop-loss, entry, and three target levels on the chart.
Colours candles based on trend (bullish or bearish).
Plots visual signals (triangles) when trend changes.
Trend Filter
Applies a two-pole smoothing filter to price for trend detection.
Uses rising/falling conditions to confirm trend strength.
Plots a coloured line and optional signals when trend changes.
Liquidity Sweeps
Identifies liquidity grabs (price sweeping highs/lows).
Marks wicks, outbreaks, and retests visually.
Highlights zones where liquidity was taken.
Candle Range Trading
Detects two-candle reversal patterns:
Bullish CRT (second candle bullish after bearish first).
Bearish CRT (second candle bearish after bullish first).
Plots markers and optional high/low box for the pattern.
RBD/DBR Patterns
Detects supply/demand patterns:
Rally → Base → Drop (RBD)
Rally → Base → Rally (RBR)
Drop → Base → Drop (DBD)
Drop → Base → Rally (DBR)
Colours bars and plots labels for these patterns.
✅ Final Signal Logic
Combines all conditions from the above strategies AND higher timeframe confirmations (HTF)
Generates:
Buy signal when all bullish conditions align.
Sell signal when all bearish conditions align.
Plots Buy/Sell labels and triggers alerts.
⚠️ Key Notes
This is a confluence-based system: signals appear only when multiple strategies agree.
It uses multi-timeframe analysis, which can repaint if not handled carefully.
Heavy use of lines, labels, and arrays → may impact performance on lower-end devices.
Note di rilascio
Purpose of the IndicatorThe script combines multiple trading concepts into a single system called Liquidity Trend System, designed to identify trend direction, liquidity sweeps, and price action patterns, and then generate buy/sell signals.
Key Components
Target Trend (BigBeluga)
Detects trend direction using moving averages and ATR-based bands.
Plots trend-coloured candles, trailing stops, and dynamic target levels (stop loss and multiple profit targets).
Marks trend reversal signals with visual shapes.
Trend Filter (Two-Pole)
Applies a two-pole smoothing filter to price for trend confirmation.
Highlights rising/falling momentum and plots colour gradients based on strength.
Optional alerts for strong trend shifts.
Liquidity Sweeps (LuxAlgo)
Identifies liquidity grabs around pivot highs/lows (wick sweeps and breakout/retest behaviour).
Draws boxes and lines to visualise sweep zones and mitigation.
Candle Range Trading (CRT)
Detects two-candle reversal patterns (Bullish/Bearish CRT).
Plots markers and optional high/low range boxes for these setups.
Rally-Base-Drop / Rally-Base-Rally Patterns
Recognises institutional price action patterns (RBD, RBR, DBD, DBR).
Colours bars and plots labels for detected patterns.
Final Signal Logic
Combines conditions from all modules (trend, filter, liquidity sweeps, CRT, and RBD patterns) across current and higher timeframes.
Generates Buy or Sell signals only when all conditions align.
Alerts are provided for Buy, Sell, and combined signals.
Note di rilascio
Liquidity Trend System (LTS) is a composite, overlay indicator that combines five signal modules:Target Trend – Trend determination with ATR-based trailing levels, visual targets, and stop/entry lines.
Trend Filter (2‑pole) – A smoothed trend filter using a custom two‑pole algorithm with rising/falling logic and optional signals/bar coloring.
Liquidity Sweeps – Detects liquidity grabs around swing highs/lows (wicks, breakouts, and retests) and extends mitigation boxes.
Candle Range Trading – Two‑candle pattern that flags bullish/bearish CRT setups and draws a range box.
Rally‑Base‑Drop Signals – Identifies sequence patterns (RBD, RBR, DBD, DBR) and colors bars/plots labels accordingly.
The script aggregates the per‑module “buy” and “sell” conditions (including a higher‑timeframe confirmation for two of them) and then plots compact Buy/Sell labels with corresponding alerts.
Script protetto
Questo script è pubblicato come codice protetto. Tuttavia, è possibile utilizzarle liberamente e senza alcuna limitazione – ulteriori informazioni qui.
Declinazione di responsabilità
Le informazioni e le pubblicazioni non sono intese come, e non costituiscono, consulenza o raccomandazioni finanziarie, di investimento, di trading o di altro tipo fornite o approvate da TradingView. Per ulteriori informazioni, consultare i Termini di utilizzo.