OPEN-SOURCE SCRIPT
Aggiornato Enio_SPX_Accumulation/Distribution
This indicator handles the same inputs used for classic Accumulation and Distribution indicators, but performs the calculations in a different way.
This indicator is used to compare the positive volume (up volume) and the number of advancing stocks against the negative volume (down volume) and the number of declining stocks.
This indicator only measures SPX market breadth (Advancing issues, Declining issues) and SPX volume (Up and down volume)so it is for use only with SPX, SPY or MES. It can also be used with ES, but data outside of regular trading hours is not provided, the indicator in those cases will print a block of the same height and same color as the last RTH bar.
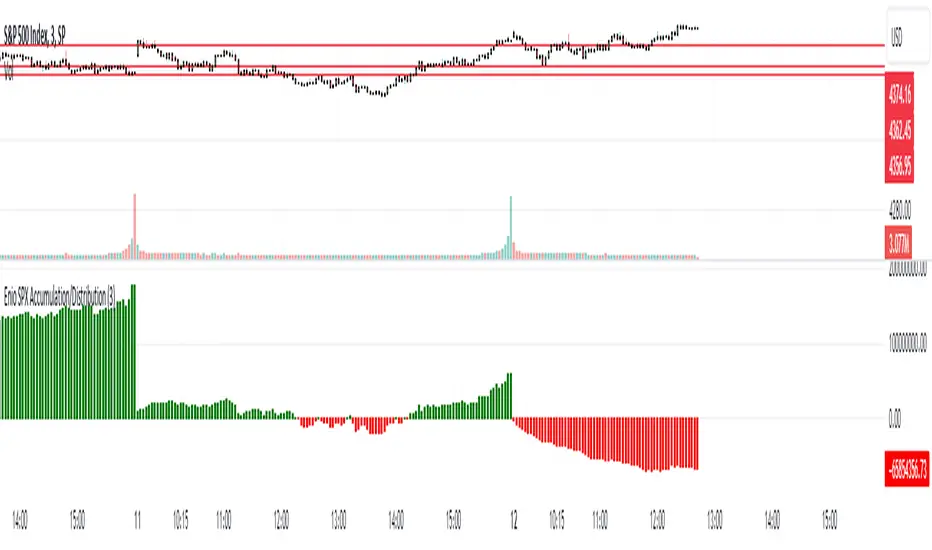
When the histogram is positive or green, the bars change to a lighter color if the current bar is less than the average of the last 3 bars. A continued set of bars with a lighter color could mean that the trend is about to change.
When the histogram is negative or red, the bars change to a lighter color if the current bar is greater than the average of the last 3 bars. A continued set of bars with a lighter color could mean that the trend is about to change.
When the histogram height is low, could signal a choppy market (SPX).
The histogram can help indicate a trending market when the opening trend is maintained and the color of the bars does not change, for example, a solid green increasing histogram can indicate a bullish trending market, while a solid red decreasing histogram will indicate a strong bearish trend.
In intraday trading the indicator can signal if the SPX price changes are supported by volume and market breadth and also allows you to see when these changes or trend are weakening.
The change from green (positive) to red (negative) and vice versa should not be taken alone as a buy/sell signal but as a confirmation of signals from other indicators you trust.
Due to the great specific weight that some stocks have within the SPX price calculation, the divergences of this indicator with SPX, can be taken as warning signals, but should not become an element of trading decisions.. You could see a negative histogram while SPX is positive and vice versa.
This indicator is used to compare the positive volume (up volume) and the number of advancing stocks against the negative volume (down volume) and the number of declining stocks.
This indicator only measures SPX market breadth (Advancing issues, Declining issues) and SPX volume (Up and down volume)so it is for use only with SPX, SPY or MES. It can also be used with ES, but data outside of regular trading hours is not provided, the indicator in those cases will print a block of the same height and same color as the last RTH bar.
When the histogram is positive or green, the bars change to a lighter color if the current bar is less than the average of the last 3 bars. A continued set of bars with a lighter color could mean that the trend is about to change.
When the histogram is negative or red, the bars change to a lighter color if the current bar is greater than the average of the last 3 bars. A continued set of bars with a lighter color could mean that the trend is about to change.
When the histogram height is low, could signal a choppy market (SPX).
The histogram can help indicate a trending market when the opening trend is maintained and the color of the bars does not change, for example, a solid green increasing histogram can indicate a bullish trending market, while a solid red decreasing histogram will indicate a strong bearish trend.
In intraday trading the indicator can signal if the SPX price changes are supported by volume and market breadth and also allows you to see when these changes or trend are weakening.
The change from green (positive) to red (negative) and vice versa should not be taken alone as a buy/sell signal but as a confirmation of signals from other indicators you trust.
Due to the great specific weight that some stocks have within the SPX price calculation, the divergences of this indicator with SPX, can be taken as warning signals, but should not become an element of trading decisions.. You could see a negative histogram while SPX is positive and vice versa.
Note di rilascio
This indicator handles the same inputs used for classic Accumulation and Distribution indicators, but performs the calculations in a different way.This indicator is used to compare the positive volume (up volume) and the number of advancing stocks against the negative volume (down volume) and the number of declining stocks.
This indicator uses NYSE market breadth, Advancing issues and Declining issues; and NYSE Up and Down volume, but considering most if not all SPX 500 stocks trade at the NYSE, we use it to measure SPX market breadth as well.
The indicator can be used with SPX, SPY, MES, RUT and IWM. This indicator uses RTH data, so using it during GTH will not work. It can used with ES, and RTY, but only during Regular Trading Hours.
When the histogram is positive or green, the bars change to a lighter color if the current bar is less than the average of the last 3 bars. A continued set of bars with a lighter color could mean that the trend is about to change.
When the histogram is negative or red, the bars change to a lighter color if the current bar is smaller in size (grater in value) than the average of the last 3 bars. A continued set of bars with a lighter color could mean that the trend is about to change.
If the histogram is green the opposite will happen, as bars are getting smaller (smaller value), they will change to a lighter green when the current bar value is smaller than the average of the precendent 3 bars. The comparison period can be adjusted by the user
When the histogram height is low, could signal a choppy market (SPX).
The histogram can help indicate a trending market when the opening trend is maintained (bars are increasingly larger) and the color of the bars does not change, for example, a solid green increasing in height histogram can indicate a bullish trending market, while a solid red decreasing histogram will indicate a strong bearish trend.
In intraday trading the indicator can signal if the SPX price changes are supported by volume and market breadth and also allows you to see when these changes or trend are weakening.
The change from green (positive) to red (negative) and vice versa should not be taken alone as a buy/sell signal but as a confirmation of signals from other indicators you trust.
Due to the great specific weight that some stocks have within the SPX price calculation, the divergences of this indicator with SPX, can be taken as warning signals, but should not become an stand alone element of trading decisions. You could see a negative histogram while SPX is positive and vice versa.
Script open-source
In pieno spirito TradingView, il creatore di questo script lo ha reso open-source, in modo che i trader possano esaminarlo e verificarne la funzionalità. Complimenti all'autore! Sebbene sia possibile utilizzarlo gratuitamente, ricorda che la ripubblicazione del codice è soggetta al nostro Regolamento.
Declinazione di responsabilità
Le informazioni ed i contenuti pubblicati non costituiscono in alcun modo una sollecitazione ad investire o ad operare nei mercati finanziari. Non sono inoltre fornite o supportate da TradingView. Maggiori dettagli nelle Condizioni d'uso.