OPEN-SOURCE SCRIPT
Aggiornato RSI +ADX Martket Trend
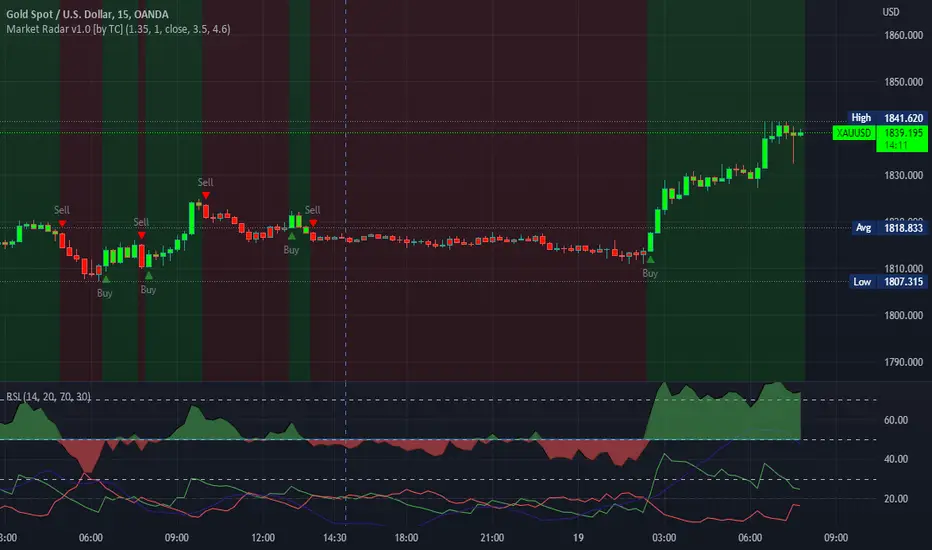
Hi Please find the useful trend direction indicator
Note di rilascio
//version=4study(title="RSI Market", shorttitle="RSI", format=format.price, precision=2)
src = close, len = input(14, minval=1, title="Length"), th = input(20),
up = rma(max(change(src), 0), len)
down = rma(-min(change(src), 0), len)
rsi = down == 0 ? 100 : up == 0 ? 0 : 100 - (100 / (1 + up / down))
plot(rsi, color=#000000, title="RSI", transp=0, linewidth=1)
rv = rsi
ob = input(title="Overbought", type=input.integer, defval = 70)
us = input(title="Undersold", type=input.integer, defval = 30)
h1 = hline(ob, color=#b2b5be, linestyle=hline.style_dashed, title="Overbought")
h2 = hline(50, color=#b2b5be, linestyle=hline.style_dashed, title="middle")
h3 = hline(us, color=#b2b5be, linestyle=hline.style_dashed, title="Undersold")
ref = plot(50, editable=false, title="Overbought")
oblv = plot(rv>50? rv : 50, transp=100, editable=false, title="Uptrend", display=display.none)
obld = plot(rv>50? 50 : rv, transp=100, editable=false, title="Downtrend", display=display.none)
fill(oblv,ref, color=color.green, transp=50, title="Up trend")
fill(obld,ref, color=color.red, transp=50, title="Down trend")
switch=input(true, title="Show consolidation areas? (The color changes there each bar)")
ShowConsolidation = 2
GetBgColor = iff( (hl2 > hl2[1]) and (hlc3 > hlc3[1]) and (close > close[1]) and (hl2[1] > hl2[2]) and (hlc3[1] > hlc3[2]) and (close[1] > close[2]), 1,
iff( (hl2 < hl2[1]) and (hlc3 < hlc3[1]) and (close < close[1]) and (hl2[1] < hl2[2]) and (hlc3[1] < hlc3[2]) and (close[1] < close[2]), -1, nz(GetBgColor[switch?ShowConsolidation:1], 0) ))
SelectBgColor = GetBgColor == -1 ? red: GetBgColor == 1 ? green: na
bgcolor(SelectBgColor, transp = 85)
Script open-source
Nello spirito di TradingView, l'autore di questo script lo ha reso open source, in modo che i trader possano esaminarne e verificarne la funzionalità. Complimenti all'autore! Sebbene sia possibile utilizzarlo gratuitamente, ricordiamo che la ripubblicazione del codice è soggetta al nostro Regolamento.
Declinazione di responsabilità
Le informazioni e le pubblicazioni non sono intese come, e non costituiscono, consulenza o raccomandazioni finanziarie, di investimento, di trading o di altro tipo fornite o approvate da TradingView. Per ulteriori informazioni, consultare i Termini di utilizzo.