OPEN-SOURCE SCRIPT
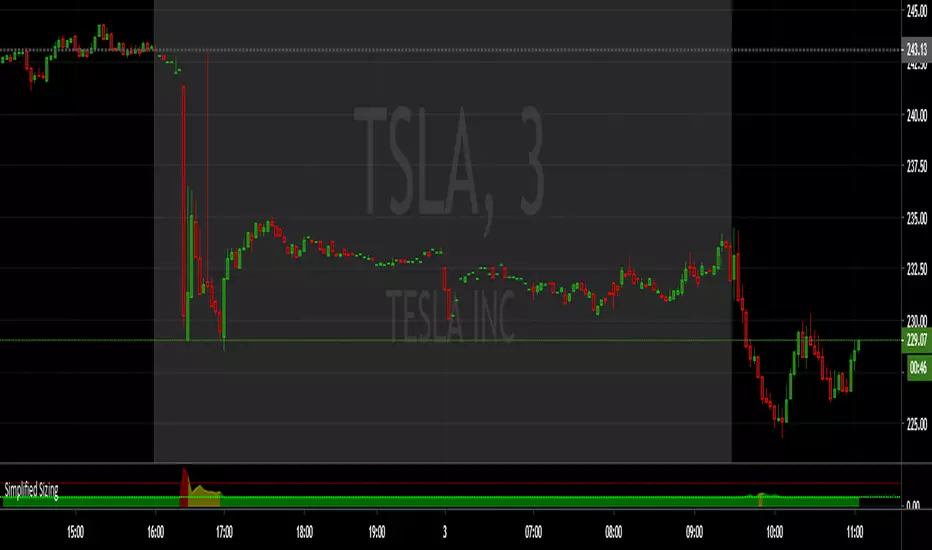
Simplified Sizing

Ensure you Uncheck #1 , #2, #3 in the STYLE tab or it draws the lines you only need the numbers for.
The first number is the deviation from the EMA , anything below 1.75 == 1. (less than 0.75 % deviation)
NOTE: The fill area turns yellow @ 1.50 and red above 2.75
There are steps built in to slightly lower share size when specific levels of divergence register:
From 1.75 to 10 , 1 == 1.10 (10% reduction)
From 10 and up, 1 == 1.20 (20% reduction)
The second number is the Average True Range , calculated by the input length (RMA smoothed) and a multiplier (in decimal form).
NOTE: From 930-936 this value is multiplied by 1.5
The third number is the max share size.
The 4th number is the lot price if you take a position at the max size.
INPUTS:
ATR Length
EMA Length for divergence calculation
ATR Multiplier (0.1 - 10)
Equity in account
Max loss per trade.
Good Luck!
Script open-source
Nello spirito di TradingView, l'autore di questo script lo ha reso open source, in modo che i trader possano esaminarne e verificarne la funzionalità. Complimenti all'autore! Sebbene sia possibile utilizzarlo gratuitamente, ricordiamo che la ripubblicazione del codice è soggetta al nostro Regolamento.
Declinazione di responsabilità
Le informazioni e le pubblicazioni non sono intese come, e non costituiscono, consulenza o raccomandazioni finanziarie, di investimento, di trading o di altro tipo fornite o approvate da TradingView. Per ulteriori informazioni, consultare i Termini di utilizzo.