OPEN-SOURCE SCRIPT
Aggiornato WonderTrend Indicator

Determining trends and reversals are the keys to trading, yet very difficult. Parabolic SAR is hard to trade during choppy price action. SuperTrend is a bit late in determining changes of trend and not great and exit signals.
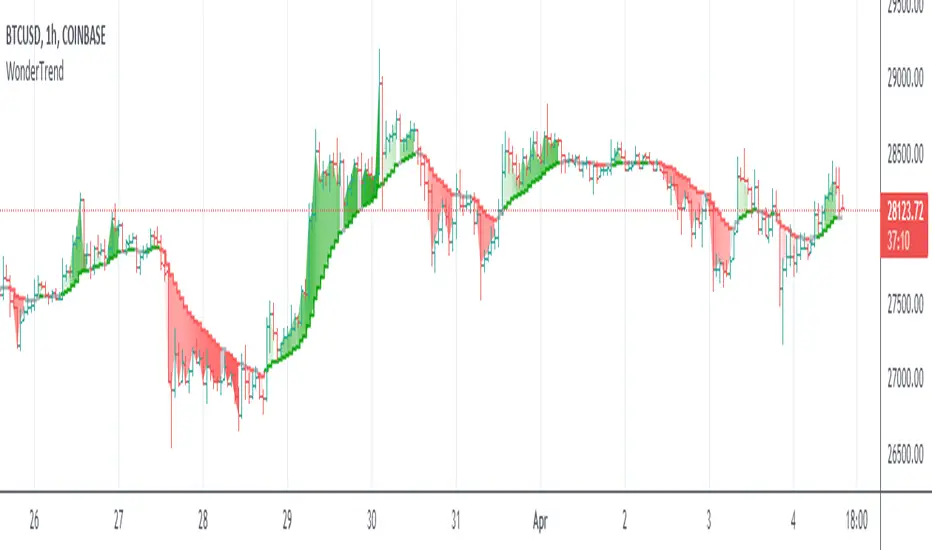
So WonderTrend is a bit of both, a more stubborn PSAR, also a faster SuperTrend. The green is up, red is down, and yellow is caution helps traders read the chart patterns to enter and exit.
Enjoy!
So WonderTrend is a bit of both, a more stubborn PSAR, also a faster SuperTrend. The green is up, red is down, and yellow is caution helps traders read the chart patterns to enter and exit.
Enjoy!
Note di rilascio
The long-awaited update to WonderTrend. The shading is produced by measuring the gap and the rounding angles. The result shown allows traders to visually "see" the current trend, and avoid dormant price action.
Rules that may be helpful:
1. The beginning of the color segments are good entry points. You'll notice that good trends are color shaded.
2. The best exits depend on your target and psyche :)
3. When there's no shading, it's drifting. The slope acts as a prevailing wind, and may predict the direction for the next color segment.
Script open-source
Nello spirito di TradingView, l'autore di questo script lo ha reso open source, in modo che i trader possano esaminarne e verificarne la funzionalità. Complimenti all'autore! Sebbene sia possibile utilizzarlo gratuitamente, ricordiamo che la ripubblicazione del codice è soggetta al nostro Regolamento.
Declinazione di responsabilità
Le informazioni e le pubblicazioni non sono intese come, e non costituiscono, consulenza o raccomandazioni finanziarie, di investimento, di trading o di altro tipo fornite o approvate da TradingView. Per ulteriori informazioni, consultare i Termini di utilizzo.