PROTECTED SOURCE SCRIPT
Aggiornato Daily Engulfing Pattern Detector
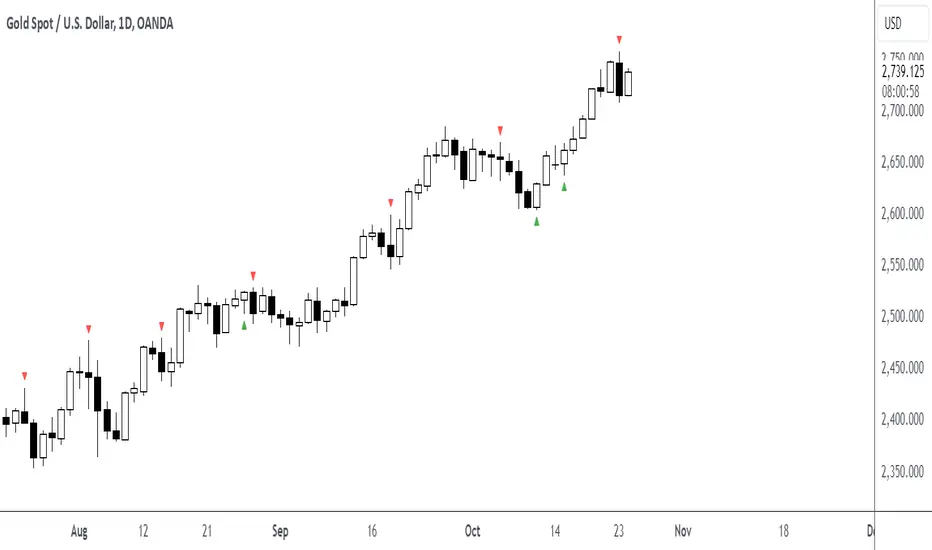
This indicator identifies bullish and bearish engulfing patterns on daily timeframes.
A bullish engulfing pattern occurs when a green candle completely engulfs the previous red candle,
taking out its low and closing above both its open and close prices. This suggests a potential trend reversal from bearish to bullish.
A bearish engulfing pattern occurs when a red candle completely engulfs the previous green candle,
taking out its high and closing below both its open and close prices. This suggests a potential trend reversal from bullish to bearish.
Features:
- Works on daily timeframe by default (customizable)
- Displays visual markers: green triangles for bullish patterns, red triangles for bearish patterns
- Includes built-in alerts for both pattern types
Set up alerts by right-clicking the indicator and selecting "Create Alert"
Note di rilascio
This indicator identifies bullish and bearish engulfing patterns on daily timeframes.A bullish engulfing pattern occurs when a green candle completely engulfs the previous red candle,
taking out its low and closing above both its open and close prices. This suggests a potential trend reversal from bearish to bullish.
A bearish engulfing pattern occurs when a red candle completely engulfs the previous green candle,
taking out its high and closing below both its open and close prices. This suggests a potential trend reversal from bullish to bearish.
Features:
- Works on daily timeframe by default (customizable)
- Displays visual markers: green triangles for bullish patterns, red triangles for bearish patterns
- Includes built-in alerts for both pattern types
Set up alerts by right-clicking the indicator and selecting "Create Alert"
Script protetto
Questo script è pubblicato come codice protetto. Tuttavia, è possibile utilizzarle liberamente e senza alcuna limitazione – ulteriori informazioni qui.
Declinazione di responsabilità
Le informazioni e le pubblicazioni non sono intese come, e non costituiscono, consulenza o raccomandazioni finanziarie, di investimento, di trading o di altro tipo fornite o approvate da TradingView. Per ulteriori informazioni, consultare i Termini di utilizzo.