OPEN-SOURCE SCRIPT
Aggiornato RaenonX - NQ 7 Dashboard
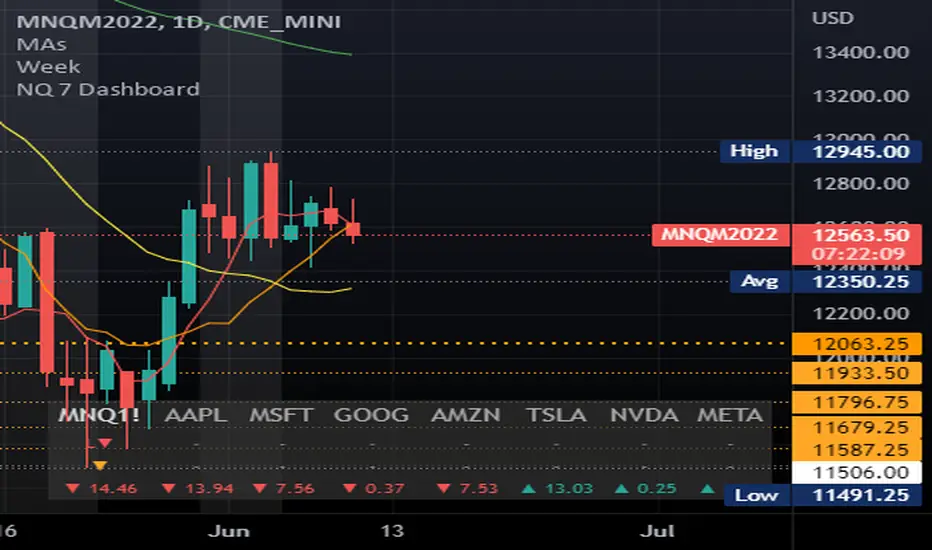
Places a table at the bottom right side showing the top 7 stocks (AAPL, MSFT, GOOG, AMZN, TSLA, NVDA, FB) current position for the given MA and daily position.
The 2nd row shows the current position related to the prior day open/high/low. There are 4 possible values:
The 3rd row shows the current position related to the given SMA parameters. The default period is 22 using 5 minutes timeframe. There are 4 possible values:
The 2nd row shows the current position related to the prior day open/high/low. There are 4 possible values:
- H+: Higher than the prior day high - indicates bullish in daily timeframe.
- O+: Higher than the prior day open - indicates pro-bullish consolidation in daily timeframe.
- L+: Higher than the prior day low - indicates pro-bearish consolidation in daily timeframe.
- L-: Lower than the prior day high - indicates bearish in daily timeframe.
The 3rd row shows the current position related to the given SMA parameters. The default period is 22 using 5 minutes timeframe. There are 4 possible values:
- B+: Higher than the SMA upper band - indicates bullish movement.
- +: Higher than the SMA - indicates pro-bullish movement, possibly consolidating.
- -: Lower than the SMA - indicates pro-bearish movement, possibly consolidating.
- B-: Lower than the SMA lower band - indicates bearish movement.
Note di rilascio
Updated band StDev input step.Note di rilascio
Updated symbols & disabled stock out of regular session regardless the settings. Note di rilascio
Added index influence value & Optimized performance.Note di rilascio
Hides main 7 stocks of NDX out of stock trading session (including pre-market and post-market).Note di rilascio
Replaced position buffering mechanism with Amplitude (was using the same mechanism of Bollinger Bands).Note di rilascio
Updated ticker from FB to META.Script open-source
Nello spirito di TradingView, l'autore di questo script lo ha reso open source, in modo che i trader possano esaminarne e verificarne la funzionalità. Complimenti all'autore! Sebbene sia possibile utilizzarlo gratuitamente, ricordiamo che la ripubblicazione del codice è soggetta al nostro Regolamento.
Declinazione di responsabilità
Le informazioni e le pubblicazioni non sono intese come, e non costituiscono, consulenza o raccomandazioni finanziarie, di investimento, di trading o di altro tipo fornite o approvate da TradingView. Per ulteriori informazioni, consultare i Termini di utilizzo.
Script open-source
Nello spirito di TradingView, l'autore di questo script lo ha reso open source, in modo che i trader possano esaminarne e verificarne la funzionalità. Complimenti all'autore! Sebbene sia possibile utilizzarlo gratuitamente, ricordiamo che la ripubblicazione del codice è soggetta al nostro Regolamento.
Declinazione di responsabilità
Le informazioni e le pubblicazioni non sono intese come, e non costituiscono, consulenza o raccomandazioni finanziarie, di investimento, di trading o di altro tipo fornite o approvate da TradingView. Per ulteriori informazioni, consultare i Termini di utilizzo.