OPEN-SOURCE SCRIPT
Overextended vs 50DMA Detector
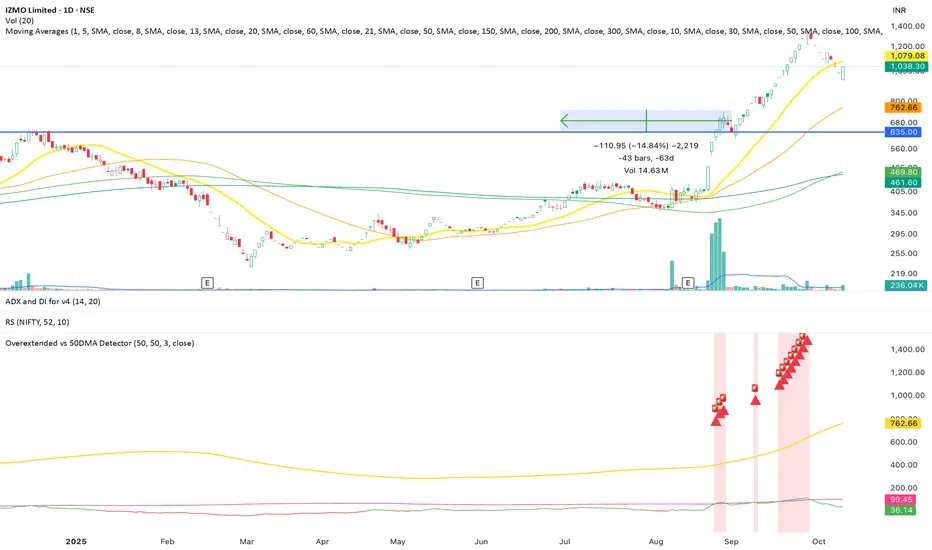
This indicator helps traders identify when a stock or asset becomes statistically overextended relative to its 50-day moving average (50DMA) — a key signal for potential pullbacks, consolidations, or profit-taking zones.
⸻
🔍 What It Does
• Calculates the 50-day simple moving average (SMA) of price.
• Computes the percentage gap between current price and the 50DMA.
• Measures the standard deviation of that percentage gap to assess volatility-adjusted extremes.
• Flags the stock as “Overextended” when:
• Price is more than 20% above the 50DMA, and
• The % gap is greater than 3× its historical standard deviation.
When these conditions are met, the script:
• Highlights the candle with a 🚨 red triangle on the chart.
• Shades the background to indicate potential overheating.
• Triggers an alert condition so traders can be notified in real time.
Script open-source
Nello spirito di TradingView, l'autore di questo script lo ha reso open source, in modo che i trader possano esaminarne e verificarne la funzionalità. Complimenti all'autore! Sebbene sia possibile utilizzarlo gratuitamente, ricordiamo che la ripubblicazione del codice è soggetta al nostro Regolamento.
Declinazione di responsabilità
Le informazioni e le pubblicazioni non sono intese come, e non costituiscono, consulenza o raccomandazioni finanziarie, di investimento, di trading o di altro tipo fornite o approvate da TradingView. Per ulteriori informazioni, consultare i Termini di utilizzo.