OPEN-SOURCE SCRIPT
CAPM Model with Returns Table

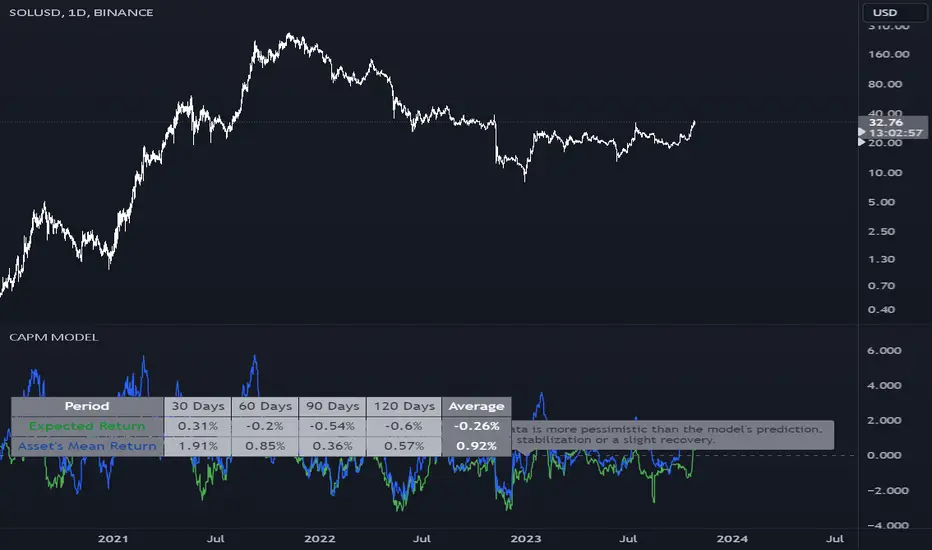
The given Pine Script is designed to implement the Capital Asset Pricing Model (CAPM) to calculate the expected return for a specified asset over various user-defined periods and compare it with the asset's historical mean return. The core features and functionalities of the script include:
Inputs:
Benchmark Symbol: Defaulted to "CRYPTOCAP:TOTAL". This serves as a comparison metric.
Risk-free Rate: Represents the return on an investment that is considered risk-free.
Benchmark Period: Used for plotting purposes. It doesn't affect table calculations.
Period Settings: Allows users to specify four different time periods for calculations.
Functionalities:
Computes daily returns for the benchmark and asset.
Calculates beta, which represents the volatility of the asset as compared to the volatility of the benchmark.
Uses CAPM to estimate expected returns over user-defined periods.
Generates a table displaying the expected return and asset's mean return for each period.
Provides implications based on the comparison between the expected returns and the asset's historical returns. This is showcased through a mutable label that is updated with each bar.
Visualization:
Plots expected return and asset's mean return over the benchmark period.
Provides a horizontal line to represent zero return.
Use Case:
This script can be helpful for traders or analysts looking to gauge the potential return of an asset compared to its historical performance using the CAPM. The implications provided by the script can serve as useful insights for making investment decisions. It's especially beneficial for those trading or analyzing assets in the cryptocurrency market, given the default benchmark setting.
Note: Before relying on this script for trading decisions, ensure a thorough understanding of its methodology and validate its assumptions against your research.
Script open-source
Nello spirito di TradingView, l'autore di questo script lo ha reso open source, in modo che i trader possano esaminarne e verificarne la funzionalità. Complimenti all'autore! Sebbene sia possibile utilizzarlo gratuitamente, ricordiamo che la ripubblicazione del codice è soggetta al nostro Regolamento.
Declinazione di responsabilità
Le informazioni e le pubblicazioni non sono intese come, e non costituiscono, consulenza o raccomandazioni finanziarie, di investimento, di trading o di altro tipo fornite o approvate da TradingView. Per ulteriori informazioni, consultare i Termini di utilizzo.