PROTECTED SOURCE SCRIPT
Scalping Indicator - SK Capital
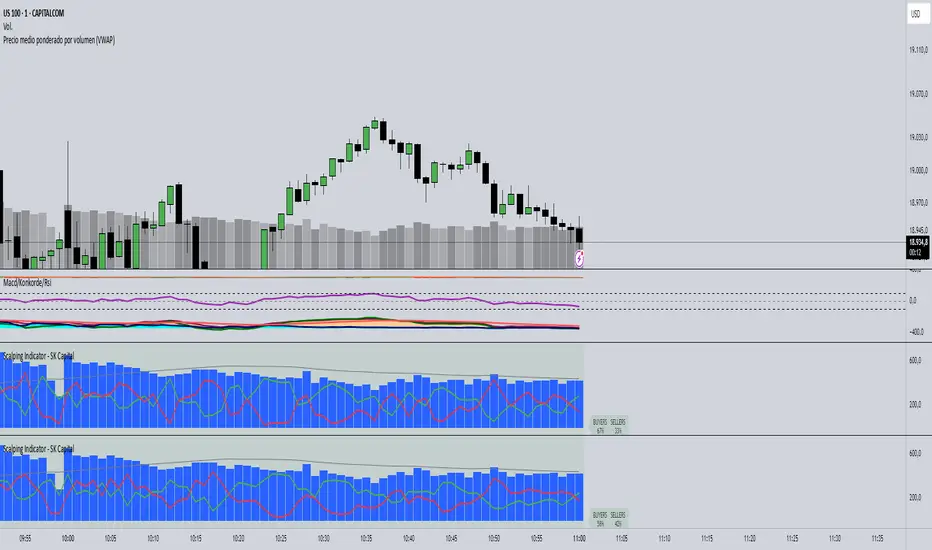
The Scalping Indicator - SK Capital is a professional-grade tool designed to empower intraday traders with real-time volume sentiment analysis and trend confirmation. Built on Pine Script v6, this indicator combines essential elements of technical trading—such as VWAP/EMA crossovers and volume decomposition—into one streamlined visualization.
Key Features:
Buyers vs. Sellers Visualization: Accurately estimates and displays the percentage of buying and selling volume within each candle. These are plotted with color-coded lines (green for buyers, red for sellers) and highlighted with a fixed summary label at the top for instant comparison.
Dynamic Sentiment Label: A prominent label at the top of the chart dynamically updates with the percentage of buyers and sellers per bar. The label’s background color shifts to green or red based on volume dominance and stays neutral when balanced, providing instant visual feedback.
Volume Histogram with Average Overlay: The total volume is represented by blue histogram bars, while a gray SMA line tracks the 50-period average volume to contextualize current activity.
Customizable Settings: Input fields allow traders to adjust the smoothing period for volume analysis, the EMA crossover length, and label font size for visual clarity.
This indicator is ideal for scalpers and short-term traders who rely on swift, data-driven decisions based on volume dynamics and trend signals. Whether you're analyzing one-minute candles or broader intraday timeframes, this script provides critical context in a compact, intuitive layout.
Script protetto
Questo script è pubblicato come codice protetto. Tuttavia, è possibile utilizzarle liberamente e senza alcuna limitazione – ulteriori informazioni qui.
Declinazione di responsabilità
Le informazioni e le pubblicazioni non sono intese come, e non costituiscono, consulenza o raccomandazioni finanziarie, di investimento, di trading o di altro tipo fornite o approvate da TradingView. Per ulteriori informazioni, consultare i Termini di utilizzo.