Multi-Timeframe RSI Oscillator -> PROFABIGHI_CAPITAL
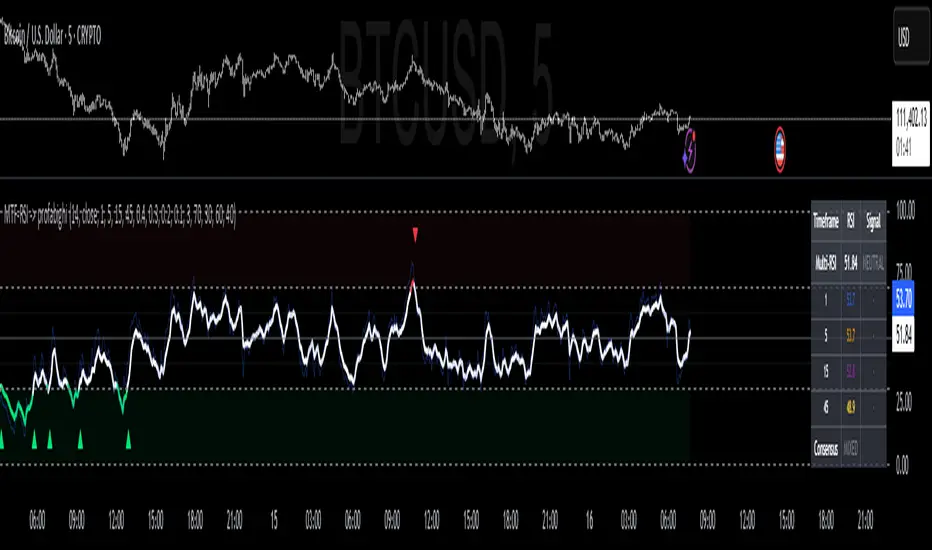
The Multi-Timeframe RSI Oscillator → PROFABIGHI_CAPITAL aggregates RSI signals from multiple timeframes into a weighted composite for layered momentum analysis, helping traders spot overbought/oversold alignments across scales without single-frame bias.
It smooths the blend for clearer trends, with optional overlays for individual readings and consensus checks to confirm directional strength.
📊 RSI Settings
– RSI Length: Adjustable lookback for computing relative strength on all selected timeframes.
– RSI Source: Data input, such as closing prices, for RSI base calculations.
⏰ Timeframes
– Timeframe 1 (Fast): Quickest scale for capturing short-term price swings and early signals.
– Timeframe 2 (Medium): Balanced scale for intermediate momentum without excessive noise.
– Timeframe 3 (Slow): Slower scale for validating trends over extended periods.
– Timeframe 4 (Ultra Slow): Longest scale for overarching market regime insights.
⚖️ Weights
– Weight 1 (Fast): Emphasis on the fastest timeframe's RSI in the overall blend.
– Weight 2 (Medium): Contribution from the medium timeframe for steady influence.
– Weight 3 (Slow): Role of the slow timeframe in anchoring the composite.
– Weight 4 (Ultra Slow): Impact of the ultra-slow timeframe for long-view stability.
👁️ Display Settings
– Smoothing Length: Period to refine the composite line via exponential averaging.
– Show Individual RSIs: Toggle to reveal separate timeframe lines for detailed comparison.
– Show Current Timeframe RSI: Option to include the chart's native RSI for reference.
📏 Levels
– Overbought Level: Upper threshold flagging potential exhaustion from buying pressure.
– Oversold Level: Lower threshold indicating possible rebound from selling fatigue.
– Neutral Upper/Lower: Inner boundaries defining the range for mild bullish or bearish tilts.
🎨 Colors
– Overbought Color: Hue for extreme upper zones and sell warnings.
– Oversold Color: Shade for deep lower zones and buy cues.
– Neutral Color: Tint for balanced readings in consolidation.
– Current TF Color: Distinct shade for the active chart's RSI line.
📈 Calculations
– Multi-Timeframe RSIs: Fetches RSI values from each selected scale, falling back to current if invalid.
– Weighted Blend: Combines readings proportionally by user weights for a unified momentum score.
– Smoothing Application: Applies exponential average to the mix for trend-smoothing without lag.
📡 Signals
– Crossover Triggers: Bullish on upward breaks from oversold; bearish on downward from overbought for reversal plays.
– Consensus Alignment: All timeframes above midline for bullish harmony; below for bearish.
– Strength Gauge: Absolute composite value measures overall conviction across scales.
📉 Visualization
– Composite Line: Prominent plot that shifts hues by zone for quick momentum assessment.
– Individual Overlays: Subtle lines for enabled timeframes, highlighting divergences when shown.
– Current TF Line: Dedicated trace for the chart's RSI to anchor analysis.
– Reference Lines: Dashed extremes, dotted neutrals, solid midline for level guidance.
– Zone Fills: Gentle shading in overbought/oversold regions for visual alerts.
– Signal Markers: Minimal triangles at crossovers for non-cluttered buy/sell hints.
– Info Table: Compact top-right summary of composite and timeframe values, signals, and consensus.
🔔 Alerts
– Buy Crossover: Notification when composite rises above oversold for potential longs.
– Sell Crossover: Warning when composite falls below overbought for potential shorts.
✅ Key Takeaways
– Layers timeframes for robust RSI without isolated-frame pitfalls.
– Weighting tunes sensitivity from aggressive to conservative views.
– Consensus and visuals unify multi-scale insights for confident trades.
– Adaptable smoothing and toggles suit any chart speed or style.
Script su invito
Solo gli utenti approvati dall'autore possono accedere a questo script. È necessario richiedere e ottenere l'autorizzazione per utilizzarlo. Tale autorizzazione viene solitamente concessa dopo il pagamento. Per ulteriori dettagli, seguire le istruzioni dell'autore riportate di seguito o contattare direttamente PROFABIGHI_CAPITAL.
TradingView NON consiglia di pagare o utilizzare uno script a meno che non ci si fidi pienamente del suo autore e non si comprenda il suo funzionamento. Puoi anche trovare alternative gratuite e open-source nei nostri script della comunità.
Istruzioni dell'autore
Declinazione di responsabilità
Script su invito
Solo gli utenti approvati dall'autore possono accedere a questo script. È necessario richiedere e ottenere l'autorizzazione per utilizzarlo. Tale autorizzazione viene solitamente concessa dopo il pagamento. Per ulteriori dettagli, seguire le istruzioni dell'autore riportate di seguito o contattare direttamente PROFABIGHI_CAPITAL.
TradingView NON consiglia di pagare o utilizzare uno script a meno che non ci si fidi pienamente del suo autore e non si comprenda il suo funzionamento. Puoi anche trovare alternative gratuite e open-source nei nostri script della comunità.