OPEN-SOURCE SCRIPT
Aggiornato [blackcat] L2 Kiosotto Indicator
OVERVIEW
The Kiosotto Indicator is a versatile technical analysis tool designed for forex trading but applicable to other financial markets. It excels in detecting market reversals and trends without repainting, ensuring consistent and reliable signals. The indicator has evolved over time, with different versions focusing on specific aspects of market analysis.
KEY FEATURES
Reversal Detection: Identifies potential market reversals, crucial for traders looking to capitalize on turning points.
Trend Detection: Earlier versions focused on detecting trends, useful for traders who prefer to follow the market direction.
Non-Repainting: Signals remain consistent on the chart, providing reliable and consistent signals.
Normalization: Later versions, such as Normalized Kiosotto and Kiosotto_2025, incorporate normalization to assess oversold and overbought conditions, enhancing interpretability.
VERSIONS AND EVOLUTION
Early Versions: Focused on trend detection, useful for following market direction.
2 in 1 Kiosotto: Emphasizes reversal detection and is considered an improvement by users.
Normalized Versions (e.g., Kiosotto_2025, Kiosotto_3_2025): Introduce normalization to assess oversold and overbought conditions, enhancing interpretability.
HOW TO USE THE KIOSOTTO INDICATOR
Understanding Signals:
Reversals: Look for the indicator's signals that suggest a potential reversal, indicated by color changes, line crossings, or other visual cues.
Trends: Earlier versions might show stronger trending signals, indicated by the direction or slope of the indicator's lines.
Normalization Interpretation (for normalized versions):
Oversold: When the indicator hits the lower boundary, it might indicate an oversold condition, suggesting a potential buy signal.
Overbought: Hitting the upper boundary could signal an overbought condition, suggesting a potential sell signal.
PINE SCRIPT IMPLEMENTATION
The provided Pine Script code is a version of the Kiosotto indicator. Here's a detailed explanation of the code:
Pine Script®
The Kiosotto Indicator is a versatile technical analysis tool designed for forex trading but applicable to other financial markets. It excels in detecting market reversals and trends without repainting, ensuring consistent and reliable signals. The indicator has evolved over time, with different versions focusing on specific aspects of market analysis.
KEY FEATURES
Reversal Detection: Identifies potential market reversals, crucial for traders looking to capitalize on turning points.
Trend Detection: Earlier versions focused on detecting trends, useful for traders who prefer to follow the market direction.
Non-Repainting: Signals remain consistent on the chart, providing reliable and consistent signals.
Normalization: Later versions, such as Normalized Kiosotto and Kiosotto_2025, incorporate normalization to assess oversold and overbought conditions, enhancing interpretability.
VERSIONS AND EVOLUTION
Early Versions: Focused on trend detection, useful for following market direction.
2 in 1 Kiosotto: Emphasizes reversal detection and is considered an improvement by users.
Normalized Versions (e.g., Kiosotto_2025, Kiosotto_3_2025): Introduce normalization to assess oversold and overbought conditions, enhancing interpretability.
HOW TO USE THE KIOSOTTO INDICATOR
Understanding Signals:
Reversals: Look for the indicator's signals that suggest a potential reversal, indicated by color changes, line crossings, or other visual cues.
Trends: Earlier versions might show stronger trending signals, indicated by the direction or slope of the indicator's lines.
Normalization Interpretation (for normalized versions):
Oversold: When the indicator hits the lower boundary, it might indicate an oversold condition, suggesting a potential buy signal.
Overbought: Hitting the upper boundary could signal an overbought condition, suggesting a potential sell signal.
PINE SCRIPT IMPLEMENTATION
The provided Pine Script code is a version of the Kiosotto indicator. Here's a detailed explanation of the code:
//@version=5
indicator("[blackcat] L2 Kiosotto Indicator", overlay=false)
//Pine version of Kiosotto 2015 v4 Alert [mobidik]ms-nrp
// Input parameters
dev_period = input.int(150, "Dev Period")
alerts_level = input.float(15, "Alerts Level")
tsbul = 0.0
tsber = 0.0
hpres = 0.0
lpres = 9999999.0
for i = 0 to dev_period - 1
rsi = ta.rsi(close, dev_period)
if high > hpres
hpres := high
tsbul := tsbul + rsi * close
if low < lpres
lpres := low
tsber := tsber + rsi * close
buffer1 = tsber != 0 ? tsbul / tsber : 0
buffer2 = tsbul != 0 ? tsber / tsbul : 0
// Plotting
plot(buffer1, color=color.aqua, linewidth=3, style=plot.style_histogram)
plot(buffer2, color=color.fuchsia, linewidth=3, style=plot.style_histogram)
hline(alerts_level, color=color.silver)
EXPLANATION OF THE CODE
Indicator Definition:
indicator("[blackcat] L2 Kiosotto Indicator", overlay=false): Defines the indicator with the name "[blackcat] L2 Kiosotto Indicator" and specifies that it should not be overlaid on the price chart.
Input Parameters:
dev_period = input.int(150, "Dev Period"): Allows users to set the period for the deviation calculation.
alerts_level = input.float(15, "Alerts Level"): Allows users to set the level for alerts.
Initialization:
tsbul = 0.0: Initializes the tsbul variable to 0.0.
tsber = 0.0: Initializes the tsber variable to 0.0.
hpres = 0.0: Initializes the hpres variable to 0.0.
lpres = 9999999.0: Initializes the lpres variable to a very high value.
Loop for Calculation:
The for loop iterates over the last dev_period bars.
rsi = ta.rsi(close, dev_period): Calculates the RSI for the current bar.
if high > hpres: If the high price of the current bar is greater than hpres, update hpres and add the product of RSI and close price to tsbul.
if low < lpres: If the low price of the current bar is less than lpres, update lpres and add the product of RSI and close price to tsber.
Buffer Calculation:
buffer1 = tsber != 0 ? tsbul / tsber : 0: Calculates the first buffer as the ratio of tsbul to tsber if tsber is not zero.
buffer2 = tsbul != 0 ? tsber / tsbul : 0: Calculates the second buffer as the ratio of tsber to tsbul if tsbul is not zero.
Plotting:
plot(buffer1, color=color.aqua, linewidth=3, style=plot.style_histogram): Plots the first buffer as a histogram with an aqua color.
plot(buffer2, color=color.fuchsia, linewidth=3, style=plot.style_histogram): Plots the second buffer as a histogram with a fuchsia color.
hline(alerts_level, color=color.silver): Draws a horizontal line at the alerts_level with a silver color.
FUNCTIONALITY
The Kiosotto indicator calculates two buffers based on the RSI and price levels over a specified period. The buffers are plotted as histograms, and a horizontal line is drawn at the alerts level. The indicator helps traders identify potential reversals and trends by analyzing the relationship between the RSI and price levels.
ALGORITHMS
RSI Calculation:
The Relative Strength Index (RSI) measures the speed and change of price movements. It is calculated using the formula:
RSI=100− (1+RS) / 100
where RS is the ratio of the average gain to the average loss over the specified period.
Buffer Calculation:
The buffers are calculated as the ratio of the sum of RSI multiplied by the close price for high and low price conditions. This helps in identifying the balance between buying and selling pressure.
Signal Generation:
The indicator generates signals based on the values of the buffers and the alerts level. Traders can use these signals to make informed trading decisions, such as entering or exiting trades based on potential reversals or trends.
APPLICATION SCENARIOS
Reversal Trading: Traders can use the Kiosotto indicator to identify potential reversals by looking for significant changes in the buffer values or crossings of the alerts level.
Trend Following: The indicator can also be used to follow trends by analyzing the direction and slope of the buffer lines.
Oversold/Overbought Conditions: For normalized versions, traders can use the indicator to identify oversold and overbought conditions, which can provide buy or sell signals.
THANKS
Special thanks to the TradingView community and the original developers for their contributions and support in creating and refining the Kiosotto Indicator.
Note di rilascio
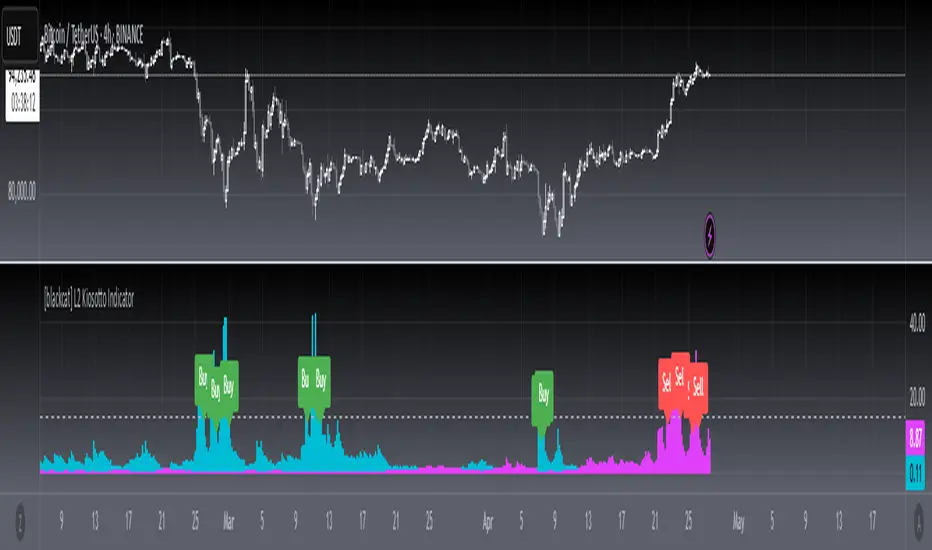
OVERVIEW The L2 Kiosotto Indicator combines RSI-based momentum measurements with historical price extremes to identify potential buying and selling opportunities in the markets.FEATURES
• Dynamic Momentum Measurement:
Bullish/Bearish ratio calculation using weighted RSI values
Historical high-low price range consideration
Customizable deviation period and alert thresholds
• Visual Representation:
Aqua-colored bullish histograms
Fuchsia-colored bearish histograms
Silver horizontal threshold line for alerts
INPUT PARAMETERS
• Deviation Period:
Default value of 150 bars
Determines lookback window for calculations
• Alerts Threshold:
User-defined level for generating notifications
Helps filter significant divergences from noise
CALCULATION METHODOLOGY
For each bar within the specified period:
Calculates RSI at that point
Tracks new highs/lows
Accumulates weighted ratios based on price action
Final Ratios Computed As:
Bullish Ratio: Weighted sum of bull phases divided by bear phase total
Bearish Ratio: Weighted sum of bear phases divided by bull phase total
TRADING SIGNALS
[bu]BULLISH CONDITION:[/bu]
When bullish ratio exceeds user-specified alert level
Generates green "Buy" labels below chart
[bu]BEARISH CONDITION:[/bu]
When bearish ratio surpasses alert threshold
Creates red "Sell" markers beneath graph
HOW TO USE
Adjust 'Dev Period' to match your preferred time horizon
Set 'Alerts Level' according to risk tolerance or strategy requirements
Monitor histogram divergence patterns relative to the threshold line
Utilize both visual indicators and alert messages for confirmation
NOTES
This indicator works best as part of a comprehensive trading system rather than standalone decisions. Consider backtesting configurations before live application.
Script open-source
Nello spirito di TradingView, l'autore di questo script lo ha reso open source, in modo che i trader possano esaminarne e verificarne la funzionalità. Complimenti all'autore! Sebbene sia possibile utilizzarlo gratuitamente, ricordiamo che la ripubblicazione del codice è soggetta al nostro Regolamento.
Avoid losing contact!Don't miss out! The first and most important thing to do is to join my Discord chat now! Click here to start your adventure: discord.com/invite/ZTGpQJq 防止失联,请立即行动,加入本猫聊天群: discord.com/invite/ZTGpQJq
Declinazione di responsabilità
Le informazioni e le pubblicazioni non sono intese come, e non costituiscono, consulenza o raccomandazioni finanziarie, di investimento, di trading o di altro tipo fornite o approvate da TradingView. Per ulteriori informazioni, consultare i Termini di utilizzo.