OPEN-SOURCE SCRIPT
High/Low X Bars Ago
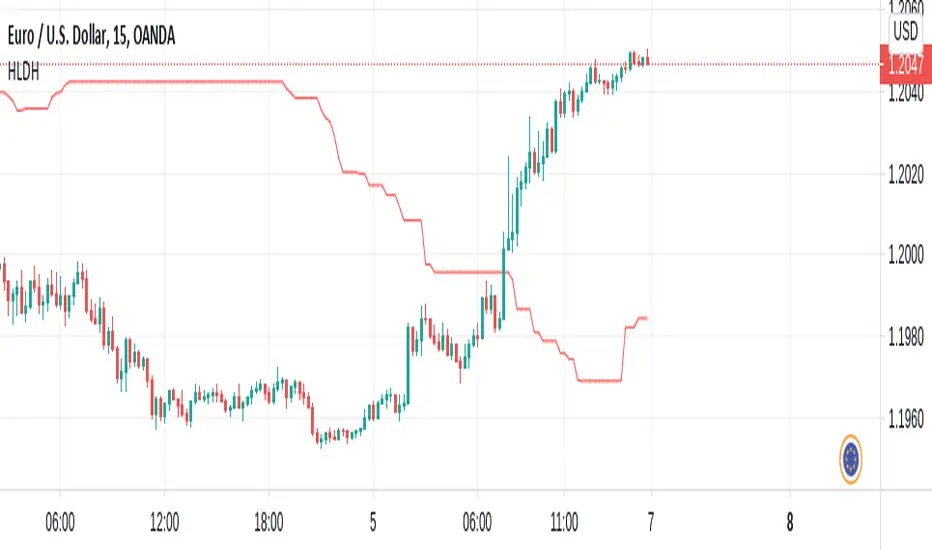
This indicator will plot a line on your chart that shows the highest high point between two previous points on the chart. It does this by reporting the highest point of X number of candles, and begins the look-back X number of candles ago.
Default candle group size is 50, and default look-back begins 50 candles back.
With these settings, the script will essentially plot the highest high point between the candle that printed 100 candles ago, and the candle that printed 50 candles ago.
Options are available for looking for the highest point, or lowest point, with configurable distances in the look-back and candle group ranges.
This script was custom built by Pine-Labs for a user who requested it.
Script open-source
Nello spirito di TradingView, l'autore di questo script lo ha reso open source, in modo che i trader possano esaminarne e verificarne la funzionalità. Complimenti all'autore! Sebbene sia possibile utilizzarlo gratuitamente, ricordiamo che la ripubblicazione del codice è soggetta al nostro Regolamento.
Declinazione di responsabilità
Le informazioni e le pubblicazioni non sono intese come, e non costituiscono, consulenza o raccomandazioni finanziarie, di investimento, di trading o di altro tipo fornite o approvate da TradingView. Per ulteriori informazioni, consultare i Termini di utilizzo.