OPEN-SOURCE SCRIPT
Aggiornato Relative Performance Spread
**Relative Performance Spread Indicator – Overview**
This indicator compares the **relative performance between two stocks** by normalizing their prices and calculating the **spread**, **area under the curve (AUC)**, or **normalized price ratio**.
### **How It Works**
* **Input**: Select a second stock (`ticker2`) and a moving average window.
* **Normalization**: Each stock is normalized by its own moving average → `norm = close / MA`.
* **Spread**: The difference `spread = norm1 - norm2` reflects which stock is outperforming.
* **AUC**: Cumulative spread over time shows prolonged dominance or underperformance.
* **Bounds**: Bollinger-style bands are drawn around the spread to assess deviation extremes.
### **Usage**
* **Plot Type Options**:
* `"Spread"`: Spot outperformance; crossing bands may signal rotation.
* `"AUC"`: Track long-term relative trend dominance.
* `"Normalized"`: Directly compare scaled price movements.
Use this tool for **pair trading**, **relative momentum**, or **rotation strategies**. It adapts well across assets with different price scales.
Note di rilascio
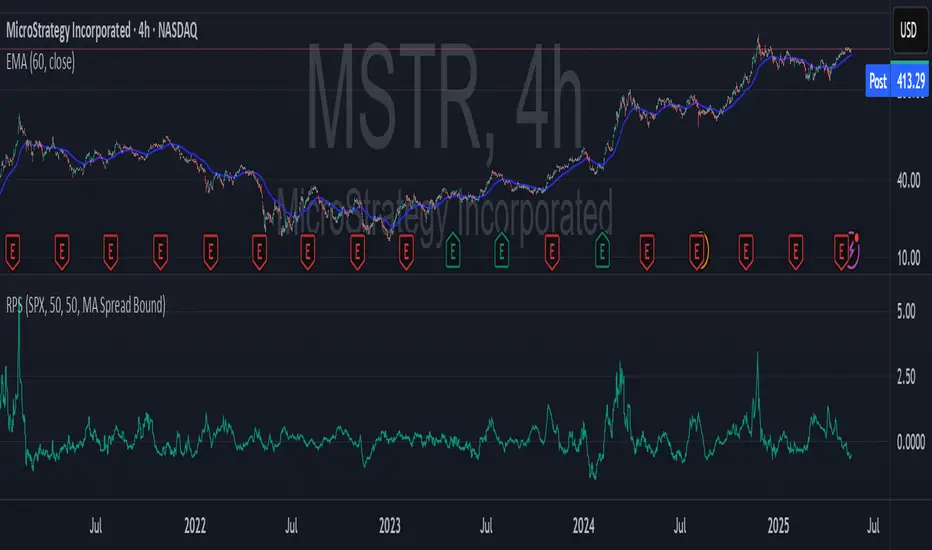
This indicator compares the performance of two stocks by analyzing their deviation from their own moving averages. It offers five plot modes:Spread: Shows the difference between the normalized prices of Stock 1 and Stock 2.
AUC (Area Under Curve): Cumulative spread over time, useful for detecting persistent out/underperformance.
Normalized: Plots each stock’s price relative to its moving average.
Z-Score Spread: Compares standardized deviations to highlight extreme divergences.
MA Spread Bound: Dynamically scales each stock’s deviation within upper/lower EMA bounds for robust comparison.
Script open-source
Nello spirito di TradingView, l'autore di questo script lo ha reso open source, in modo che i trader possano esaminarne e verificarne la funzionalità. Complimenti all'autore! Sebbene sia possibile utilizzarlo gratuitamente, ricordiamo che la ripubblicazione del codice è soggetta al nostro Regolamento.
Declinazione di responsabilità
Le informazioni e le pubblicazioni non sono intese come, e non costituiscono, consulenza o raccomandazioni finanziarie, di investimento, di trading o di altro tipo fornite o approvate da TradingView. Per ulteriori informazioni, consultare i Termini di utilizzo.