OPEN-SOURCE SCRIPT
Aggiornato Last xHL
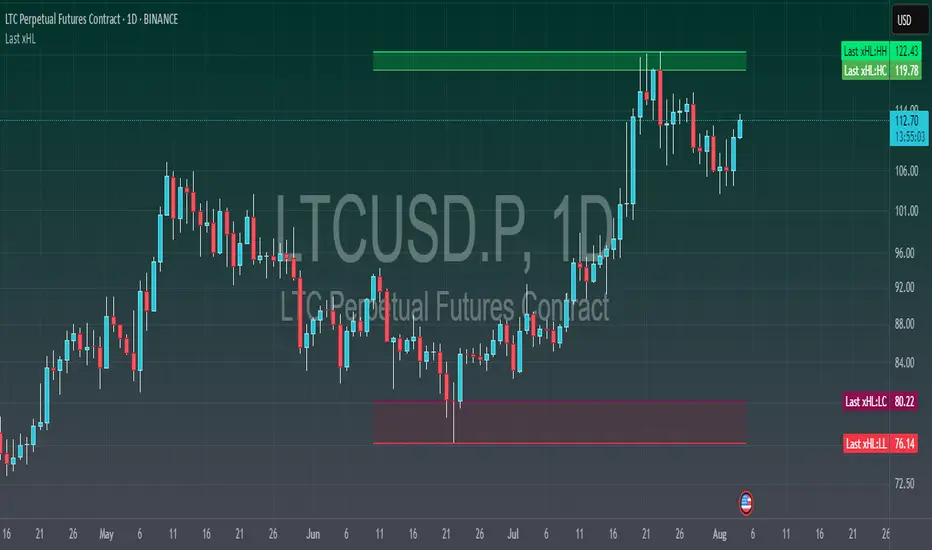
📈 Last xHL – Visualize Key Highs and Lows
This script highlights the most recent significant highs and lows over a user-defined period, helping traders quickly identify key support and resistance zones.
🔍 Features:
⚙️ Customization:
🧠 Use Case:
This tool is ideal for traders who want to:
This script highlights the most recent significant highs and lows over a user-defined period, helping traders quickly identify key support and resistance zones.
🔍 Features:
- Highest High (HH) and Highest Close/Open (HC) lines
- Lowest Low (LL) and Lowest Close/Open (LC) lines
- Dynamic updates with each new bar
- Gradient-filled zones between HH–HC and LL–LC for visual clarity
⚙️ Customization:
- Adjustable lookback period (_length) to suit your trading style
- Color-coded lines and fills for quick interpretation
🧠 Use Case:
This tool is ideal for traders who want to:
- Spot potential breakout or reversal zones
- Identify price compression or expansion areas
- Enhance their technical analysis with visual cues
This script is for educational and informational purposes only. It does not constitute financial advice. Always do your own research before making trading decisions.
Note di rilascio
✅ New Feature:The values of HH, HC, LL, and LC are now also plotted invisibly to appear in the Data Window and on the Price Scale, allowing for easier reference and analysis without cluttering the chart.
Script open-source
Nello spirito di TradingView, l'autore di questo script lo ha reso open source, in modo che i trader possano esaminarne e verificarne la funzionalità. Complimenti all'autore! Sebbene sia possibile utilizzarlo gratuitamente, ricordiamo che la ripubblicazione del codice è soggetta al nostro Regolamento.
Show your piety to your god. World needs your humanity.
Declinazione di responsabilità
Le informazioni e le pubblicazioni non sono intese come, e non costituiscono, consulenza o raccomandazioni finanziarie, di investimento, di trading o di altro tipo fornite o approvate da TradingView. Per ulteriori informazioni, consultare i Termini di utilizzo.