OPEN-SOURCE SCRIPT
small channel in 5min
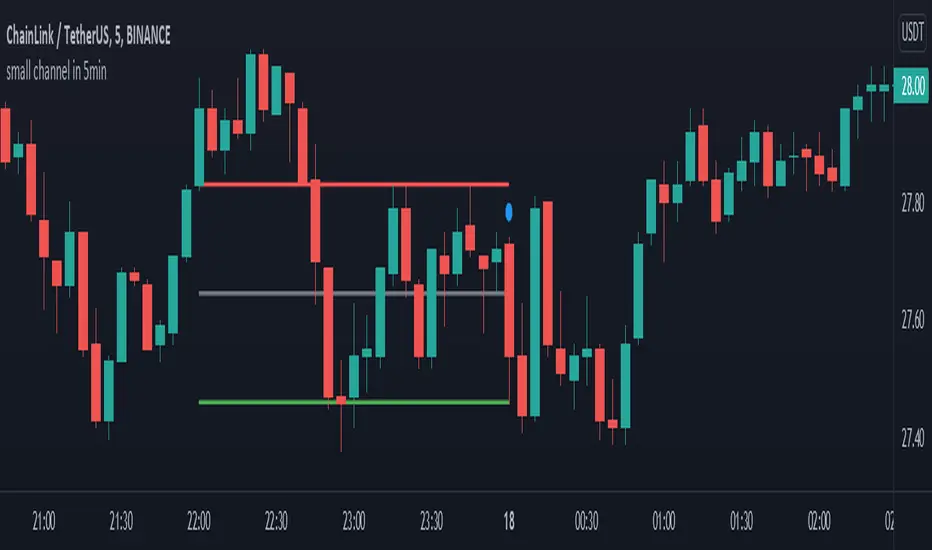
This indicator designed for 5min time-frame.
it detects a candlestick pattern in one hour time-frame and draw a channel based on the detected pattern, where two candles [0] and [1] are covered by the third one [2], in 5 min time-frame.
the bottom, middle and top of the channel are colored by green, gray and red respectively. this channel may help user to use it as a possible support and resistance region.
(the pattern is defined in line 11 to 13.)
enjoy it
Script open-source
Nello spirito di TradingView, l'autore di questo script lo ha reso open source, in modo che i trader possano esaminarne e verificarne la funzionalità. Complimenti all'autore! Sebbene sia possibile utilizzarlo gratuitamente, ricordiamo che la ripubblicazione del codice è soggetta al nostro Regolamento.
Declinazione di responsabilità
Le informazioni e le pubblicazioni non sono intese come, e non costituiscono, consulenza o raccomandazioni finanziarie, di investimento, di trading o di altro tipo fornite o approvate da TradingView. Per ulteriori informazioni, consultare i Termini di utilizzo.