OPEN-SOURCE SCRIPT
Stochastic Distance Indicator [CC]
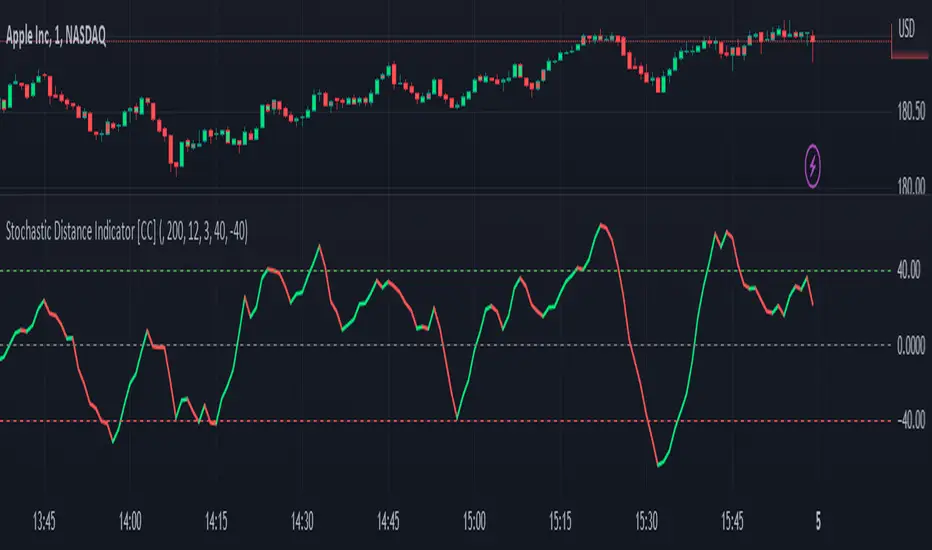
The Stochastic Distance Indicator was created by Vitali Apirine (Stocks and Commodities Jun 2023 pgs 16-21), and this is a new method that measures the absolute distance between a price and its highest and lowest values over a long period. It uses the stochastic formula to create an oscillator using this distance value and smooths the value. Obviously, there is a lag in signals due to the lookback periods, but it does a good job of staying above the midline when the stock is in a strong uptrend and vice versa. Of course, I'm open to suggestions, but I'm deciding to create buy and sell signals based on comparing the unsmoothed and smoothed values. Buy when the line turns green and sell when it turns red.
Let me know if there are any other indicators you would like to see me publish!
Let me know if there are any other indicators you would like to see me publish!
Script open-source
In pieno spirito TradingView, il creatore di questo script lo ha reso open-source, in modo che i trader possano esaminarlo e verificarne la funzionalità. Complimenti all'autore! Sebbene sia possibile utilizzarlo gratuitamente, ricorda che la ripubblicazione del codice è soggetta al nostro Regolamento.
I created the largest stock indicator library:
github.com/ooples/
Custom Indicator Requests:
forms.gle/ouMffZR3dQ8bSJQG7
Tips are appreciated:
paypal.me/cheatcountry
patreon.com/cheatcountry
github.com/ooples/
Custom Indicator Requests:
forms.gle/ouMffZR3dQ8bSJQG7
Tips are appreciated:
paypal.me/cheatcountry
patreon.com/cheatcountry
Declinazione di responsabilità
Le informazioni ed i contenuti pubblicati non costituiscono in alcun modo una sollecitazione ad investire o ad operare nei mercati finanziari. Non sono inoltre fornite o supportate da TradingView. Maggiori dettagli nelle Condizioni d'uso.