PROTECTED SOURCE SCRIPT
Dynamic Value Zone Oscillator (DVZO) - @CRYPTIK1
Dynamic Value Zone Oscillator (DVZO) CRYPTIK1
Introduction: What is the DVZO?
The Dynamic Value Zone Oscillator (DVZO) is a powerful momentum indicator that reframes the classic "overbought" and "oversold" concept. Instead of relying on a fixed lookback period like a standard RSI or Stochastics, the DVZO measures the current price relative to a significant, higher-timeframe Value Zone (e.g., the previous week's entire price range).
This gives you a more contextual and structural understanding of price. The core question it answers is not just "Is the price moving up or down quickly?" but rather, "Where is the current price in relation to its recently established area of value?"
This allows traders to identify true "premium" (overbought) and "discount" (oversold) levels with greater accuracy, leading to higher-probability reversal and trend-following signals.
The Core Concept: Price vs. Value
The market is constantly trying to find equilibrium or "fair value." The DVZO is built on the principle that the high and low of a significant prior period (like the previous day, week, or month) create a powerful area of perceived value.
By anchoring its analysis to these significant structural levels, the DVZO filters out much of the noise from lower-timeframe price fluctuations.
Key Features
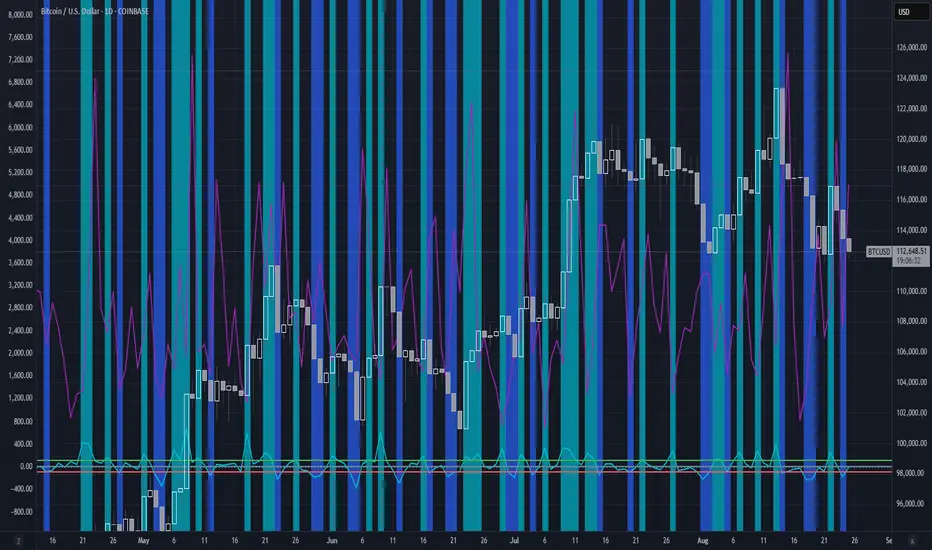
The Oscillator:
The main blue line visualizes exactly where the current price is within the context of the Value Zone.
Automatic Divergence Detection:
The DVZO automatically identifies and plots bullish and bearish divergences on both the price chart and the oscillator itself.
Value Migration Histogram:
The purple histogram in the background visualizes the width of the Value Zone.
How to Use the DVZO: Trading Strategies
1. Reversion Trading
This is the most direct way to use the indicator.
2. Divergence Trading
Divergences are powerful confirmation signals.
3. Best Practices & Settings
Introduction: What is the DVZO?
The Dynamic Value Zone Oscillator (DVZO) is a powerful momentum indicator that reframes the classic "overbought" and "oversold" concept. Instead of relying on a fixed lookback period like a standard RSI or Stochastics, the DVZO measures the current price relative to a significant, higher-timeframe Value Zone (e.g., the previous week's entire price range).
This gives you a more contextual and structural understanding of price. The core question it answers is not just "Is the price moving up or down quickly?" but rather, "Where is the current price in relation to its recently established area of value?"
This allows traders to identify true "premium" (overbought) and "discount" (oversold) levels with greater accuracy, leading to higher-probability reversal and trend-following signals.
The Core Concept: Price vs. Value
The market is constantly trying to find equilibrium or "fair value." The DVZO is built on the principle that the high and low of a significant prior period (like the previous day, week, or month) create a powerful area of perceived value.
- The Value Zone: The range between the high and low of the selected higher timeframe. The midpoint of this zone is the equilibrium (0 line on the oscillator).
- Premium Territory (Distribution Zone): When price breaks above the Value Zone High (+100 line), it is trading at a premium. This is an area where sellers are more likely to become active and buyers may be over-extending.
- Discount Territory (Accumulation Zone): When price breaks below the Value Zone Low (-100 line), it is trading at a discount. This is an area where buyers are more likely to see value and sellers may be exhausted.
By anchoring its analysis to these significant structural levels, the DVZO filters out much of the noise from lower-timeframe price fluctuations.
Key Features
The Oscillator:
The main blue line visualizes exactly where the current price is within the context of the Value Zone.
- +100: The high of the Value Zone.
- 0: The midpoint/equilibrium of the Value Zone.
- -100: The low of the Value Zone.
Automatic Divergence Detection:
The DVZO automatically identifies and plots bullish and bearish divergences on both the price chart and the oscillator itself.
- Bullish Divergence: Price makes a new low, but the DVZO makes a higher low. This is a strong signal that downside momentum is fading and a reversal to the upside is likely.
- Bearish Divergence: Price makes a new high, but the DVZO makes a lower high. This indicates that upside momentum is waning and a pullback is probable.
Value Migration Histogram:
The purple histogram in the background visualizes the width of the Value Zone.
- Expanding Histogram: Volatility is increasing, and the accepted value range is getting wider.
- Contracting Histogram: Volatility is decreasing, and the price is coiling in a tight range, often in anticipation of a major breakout.
How to Use the DVZO: Trading Strategies
1. Reversion Trading
This is the most direct way to use the indicator.
- Look for Buys: When the DVZO line drops below -100, the price is in the "Accumulation Zone." Wait for the price to show signs of strength (e.g., a bullish candle pattern) and the DVZO line to start turning back up towards the -100 level. This is a high-probability mean reversion setup.
- Look for Sells: When the DVZO line moves above +100, the price is in the "Distribution Zone." Look for signs of weakness (e.g., a bearish engulfing candle) and the DVZO line to start turning back down towards the +100 level.
2. Divergence Trading
Divergences are powerful confirmation signals.
- Entry Signal: When a Bullish Divergence appears, it provides a strong entry signal for a long position, especially if it occurs within the Accumulation Zone (below -100).
[]Exit/Short Signal: When a Bearish Divergence appears, it can serve as a signal to take profit on long positions or to look for a short entry, especially if it occurs in the Distribution Zone (above +100).
3. Best Practices & Settings
- Timeframe Synergy: The DVZO is most effective when your chart timeframe is lower than your selected Value Zone Source.
For Day Trading (e.g., 1H, 4H chart): Use the "Previous Day" Value Zone.
For Swing Trading (e.g., 1D, 12H chart): Use the "Previous Week" or "Previous Month" Value Zone. - Confirmation is Key: The DVZO is a powerful tool, but it should not be used in isolation. Always combine its signals with other forms of analysis, such as market structure, support/resistance levels, and candlestick patterns, for confirmation.
Script protetto
Questo script è pubblicato come codice protetto. Tuttavia, è possibile utilizzarle liberamente e senza alcuna limitazione – ulteriori informazioni qui.
Declinazione di responsabilità
Le informazioni e le pubblicazioni non sono intese come, e non costituiscono, consulenza o raccomandazioni finanziarie, di investimento, di trading o di altro tipo fornite o approvate da TradingView. Per ulteriori informazioni, consultare i Termini di utilizzo.