OPEN-SOURCE SCRIPT
Aggiornato Weekly and daily separators
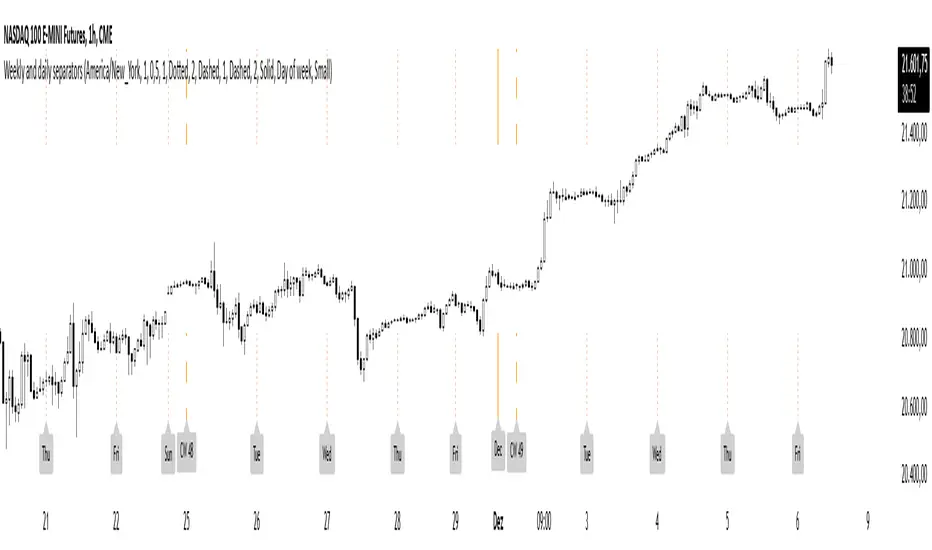
This script plots vertical line between each trading week (thick, solid) and smaller lines (dotted) between each trading day. This helps kepping a better overview on the aspect of time on the higher timeframes below 1D. The distance of the lines to the top and bottom of the chart is controlled by your chart settings menu under Appearance -> Margins.
Note di rilascio
Increased the number of lines displayedNote di rilascio
Added support to hide the daily lines on the daily chart and higher and the same for the weekly lines on the weekly chart and higher. On the timeframes from the daily and above the weekly has a secondary line width too. This should help make the charts look cleanerThis is configurable in the parameters now and the line widths can be selected.
Note di rilascio
Minor cosmetic changes and added 2 parameters for better controlNote di rilascio
Choose Line style and width independently nowNote di rilascio
Fixed color selection and changed default valuesNote di rilascio
Higher tf color optionNote di rilascio
Added monthly lineNote di rilascio
Default config changedNote di rilascio
This update includes a bunch of changes that should make the indicator easier to use and more customizable. Even more importantly I fundamentally changed the way a change of day/week/month is detected. This should now be more stable and print more consistently for each timeframe.Further added features:
- Select time zone for when the session change should be marked
- Lines don't have to paint all the way across the chart vertically but can be adjusted to just have some part of the top and bottom covered.
- Optional labels can be toggled which show the starting month, calendar week and day. Available day formats are either the weekday or the date either in the format dd.MM or MM.dd
- Default line widths and colors changed to a orange hue
Note di rilascio
Updated chart to match last major updateScript open-source
In pieno spirito TradingView, il creatore di questo script lo ha reso open-source, in modo che i trader possano esaminarlo e verificarne la funzionalità. Complimenti all'autore! Sebbene sia possibile utilizzarlo gratuitamente, ricorda che la ripubblicazione del codice è soggetta al nostro Regolamento.
Declinazione di responsabilità
Le informazioni ed i contenuti pubblicati non costituiscono in alcun modo una sollecitazione ad investire o ad operare nei mercati finanziari. Non sono inoltre fornite o supportate da TradingView. Maggiori dettagli nelle Condizioni d'uso.
Script open-source
In pieno spirito TradingView, il creatore di questo script lo ha reso open-source, in modo che i trader possano esaminarlo e verificarne la funzionalità. Complimenti all'autore! Sebbene sia possibile utilizzarlo gratuitamente, ricorda che la ripubblicazione del codice è soggetta al nostro Regolamento.
Declinazione di responsabilità
Le informazioni ed i contenuti pubblicati non costituiscono in alcun modo una sollecitazione ad investire o ad operare nei mercati finanziari. Non sono inoltre fornite o supportate da TradingView. Maggiori dettagli nelle Condizioni d'uso.