OPEN-SOURCE SCRIPT
Aggiornato Choose Symbol, candle and Trend mode
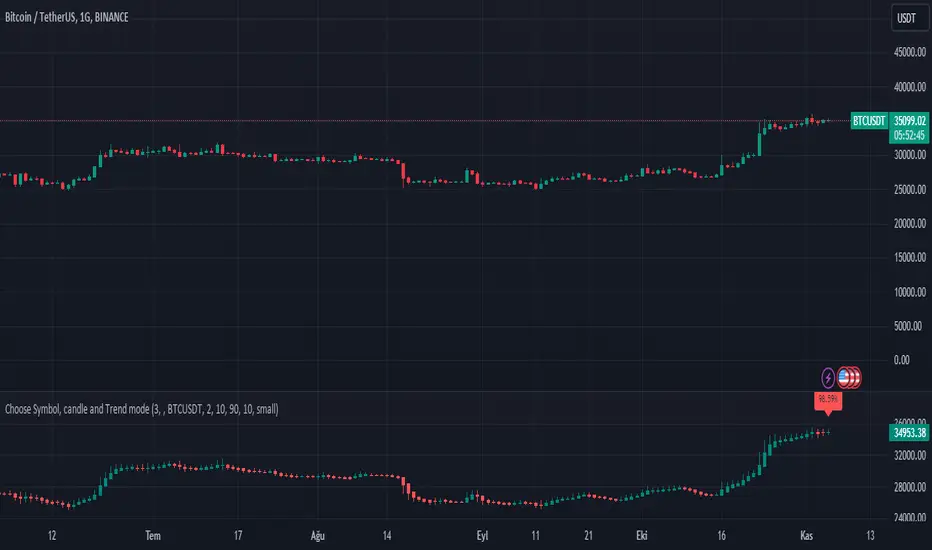
This Pine Script code is designed for technical analysis and visualization of price movements on the TradingView platform. It serves as a tool for traders and investors to:
Price Chart Analysis: The code plots the price chart of a selected symbol and utilizes Heikin-Ashi candlesticks to visualize price movements. This aids in better understanding price trends, support and resistance levels, retracements, and other price actions.
Trend Identification: The code also employs the Exponential Moving Average (EMA) to identify the price trend. EMA is commonly used to determine the strength and direction of a trend. Traders and investors can use this information to track trends and develop trading strategies.
Buy and Sell Signals: The code generates buy and sell signals based on EMA. These signals provide information on when to consider buying or selling a specific symbol. This is particularly useful for traders when making trading decisions.
Timeframe Customization: Users can adapt the code to different timeframes. This flexibility is valuable for those looking to develop strategies for both short-term and long-term trading.
Customization: The code allows users to customize various parameters, including the symbol, timeframe, Heikin-Ashi mode, and others. This enables it to be tailored to different assets and trading styles.
Please note that this code is provided for educational and informational purposes only. It does not constitute financial advice or recommendations for specific trading actions. Any trading decisions made using this code should be based on individual research, analysis, and a clear understanding of the associated risks.
Note di rilascio
This Pine Script code is designed for technical analysis and visualization of price movements on the TradingView platform. It serves as a tool for traders and investors to:Price Chart Analysis: The code plots the price chart of a selected symbol and utilizes Heikin-Ashi candlesticks to visualize price movements. This aids in better understanding price trends, support and resistance levels, retracements, and other price actions.
Trend Identification: The code also employs the Exponential Moving Average (EMA) to identify the price trend. EMA is commonly used to determine the strength and direction of a trend. Traders and investors can use this information to track trends and develop trading strategies.
Buy and Sell Signals: The code generates buy and sell signals based on EMA. These signals provide percentage information on when to consider buying or selling a specific symbol. This is particularly useful for traders when making trading decisions.
Overbought and Oversold Levels: The code allows users to set overbought and oversold levels, helping to identify potential reversal points or areas of price exhaustion.
Timeframe Customization: Users can adapt the code to different timeframes. This flexibility is valuable for those looking to develop strategies for both short-term and long-term trading.
Customization: The code allows users to customize various parameters, including the symbol, timeframe, Heikin-Ashi mode, and others. This enables it to be tailored to different assets and trading styles.
Please note that this code is provided for educational and informational purposes only. It does not constitute financial advice or recommendations for specific trading actions. Any trading decisions made using this code should be based on individual research, analysis, and a clear understanding of the associated risks.
Note di rilascio
This Pine Script code is designed for technical analysis and visualization of price movements on the TradingView platform. It serves as a tool for traders and investors to:Price Calculation: The code calculates the Exponential Moving Averages (EMA) of open, high, low, and close prices. These moving averages are used to create smoothed price values for the Heikin-Ashi chart.
Price Chart Analysis: The code plots the price chart of a selected symbol and utilizes Heikin-Ashi candlesticks to visualize price movements. This aids in better understanding price trends, support and resistance levels, retracements, and other price actions.
Trend Identification: The code also employs the Exponential Moving Average (EMA) to identify the price trend. EMA is commonly used to determine the strength and direction of a trend. Traders and investors can use this information to track trends and develop trading strategies.
Buy and Sell Signals: The code generates buy and sell signals based on EMA. These signals provide percentage information on when to consider buying or selling a specific symbol. This is particularly useful for traders when making trading decisions.
Overbought and Oversold Levels: The code allows users to set overbought and oversold levels, helping to identify potential reversal points or areas of price exhaustion.
Timeframe Customization: Users can adapt the code to different timeframes. This flexibility is valuable for those looking to develop strategies for both short-term and long-term trading.
Customization: The code allows users to customize various parameters, including the symbol, timeframe, Heikin-Ashi mode, and others. This enables it to be tailored to different assets and trading styles.
Please note that this code is provided for educational and informational purposes only. It does not constitute financial advice or recommendations for specific trading actions. Any trading decisions made using this code should be based on individual research, analysis, and a clear understanding of the associated risks.
Script open-source
Nello spirito di TradingView, l'autore di questo script lo ha reso open source, in modo che i trader possano esaminarne e verificarne la funzionalità. Complimenti all'autore! Sebbene sia possibile utilizzarlo gratuitamente, ricordiamo che la ripubblicazione del codice è soggetta al nostro Regolamento.
Declinazione di responsabilità
Le informazioni e le pubblicazioni non sono intese come, e non costituiscono, consulenza o raccomandazioni finanziarie, di investimento, di trading o di altro tipo fornite o approvate da TradingView. Per ulteriori informazioni, consultare i Termini di utilizzo.