OPEN-SOURCE SCRIPT
Aggiornato Volume Positive Negative (VPN)

The idea and calculations for the Volume Positive Negative (VPN) indicator were created by Markos Katsanos. Markos wrote about the indicator in the article Detecting High-Volume Breakouts, published in Technical Analysis of Stocks & Commodities April, 2021 (Vol. 39, Issue 5).
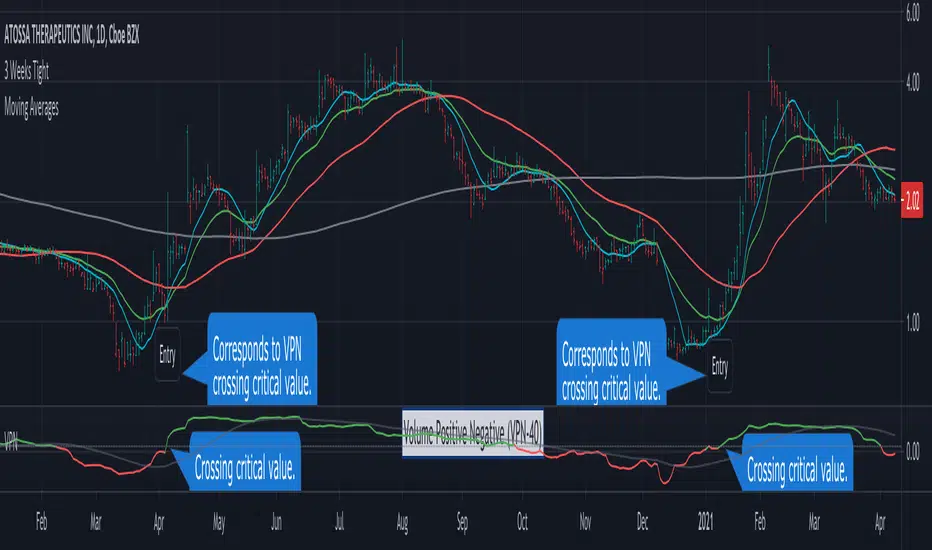
The goal of the VPN indicator is to detect breakouts using only volume. The basic idea is to compare volume on up days versus volume on down days. The indicator can oscillate between the range of -100 and 100. Values between 0 and 20 are generally considered bullish, negative are bearish.
When the plotted VPN crosses over what Markos refers to as the critical value, that may indicate a high volume breakout. The critical value can be adjusted between 0 to 20, 10 is the default,
Volume Positive Negative Calculation (VPN)
VPN = (VP - VN) / MAV / Period * 100
VP - sum of positive volume
VN - sum of negative volume
MAV - moving average of volume
Volume is considered positive when the average price is higher than the previous day's price by more than .1 of the ATR (average true range).
Note di rilascio
version 2.0From Markos Katsanos - "Each trading day the volume is classified as positive if the average stock price is higher than yesterday’s average price by more than 1/10 ATR (average true range) and the opposite for negative volume. If the average price difference is between +/- 0.10 ATR the volume is ignored."
■ Allow configuration of the fractional amount of ATR.
Note di rilascio
Publish a new chart to show Volume Positive Negative (VPN) examples.Note di rilascio
version 3.0■ Additional configuration options for the VPN moving average, including length and type (SMA or EMA).
Script open-source
In pieno spirito TradingView, il creatore di questo script lo ha reso open-source, in modo che i trader possano esaminarlo e verificarne la funzionalità. Complimenti all'autore! Sebbene sia possibile utilizzarlo gratuitamente, ricorda che la ripubblicazione del codice è soggetta al nostro Regolamento.
LevelUp Your Trading ~ TradingView® Indicators & Screeners: LevelUpTools.net
The LevelUp website also includes comprehensive video tutorials and educational content.
The LevelUp website also includes comprehensive video tutorials and educational content.
Declinazione di responsabilità
Le informazioni ed i contenuti pubblicati non costituiscono in alcun modo una sollecitazione ad investire o ad operare nei mercati finanziari. Non sono inoltre fornite o supportate da TradingView. Maggiori dettagli nelle Condizioni d'uso.