PROTECTED SOURCE SCRIPT
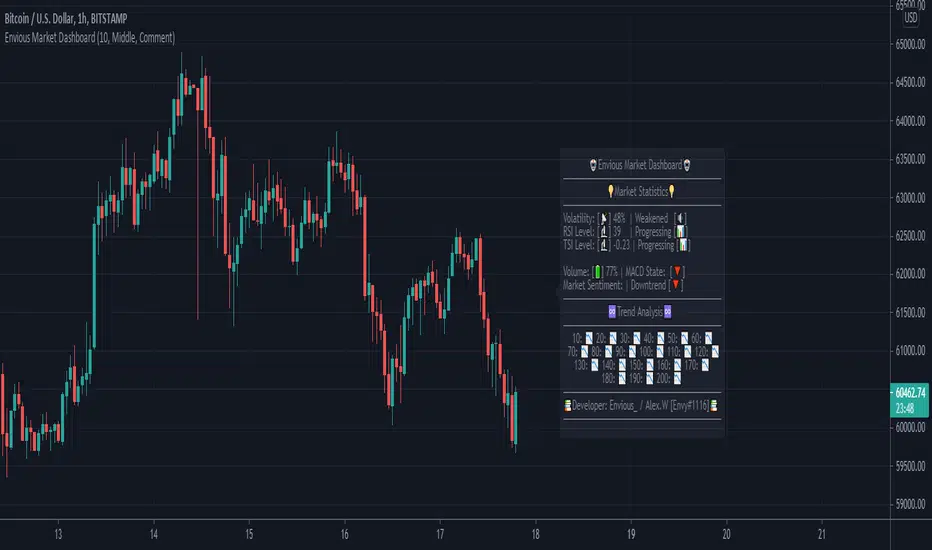
Envious Market Dashboard

Hey traders, this is a market dashboard that can be useful to have on top of your charts. It provides information of the trends discovered, the volatility, the current MACD Trend, the current trend, RSI level, RSI Overbought / Oversold state, TSI level, TSI Overbought / Oversold state, the volume percentage, and more. You can customise the dashboard location, the colour of the dashboard, the background of the dashboard and its background colour. Hope this is useful to you traders :).
Script protetto
Questo script è pubblicato come codice protetto. Tuttavia, è possibile utilizzarle liberamente e senza alcuna limitazione – ulteriori informazioni qui.
Declinazione di responsabilità
Le informazioni e le pubblicazioni non sono intese come, e non costituiscono, consulenza o raccomandazioni finanziarie, di investimento, di trading o di altro tipo fornite o approvate da TradingView. Per ulteriori informazioni, consultare i Termini di utilizzo.