PROTECTED SOURCE SCRIPT
Trend Or Range ?
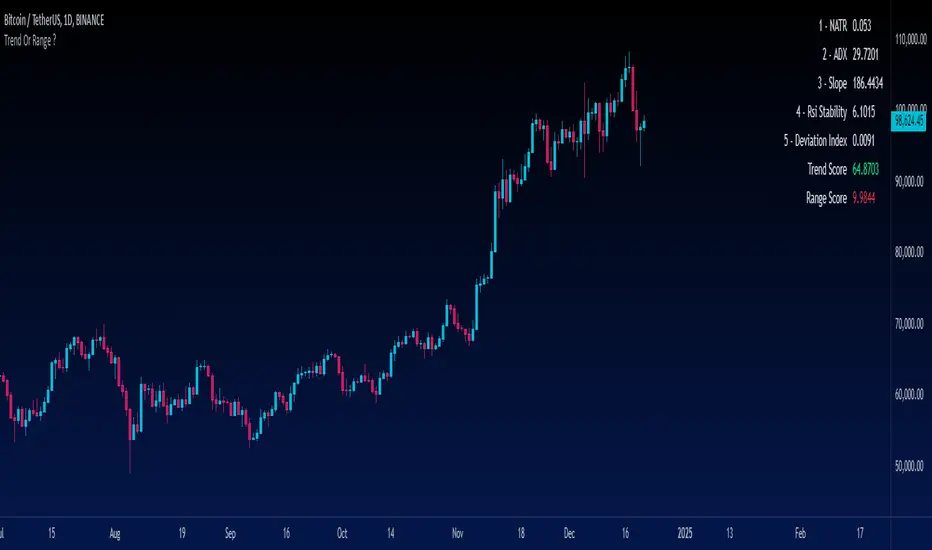
Are you uncertain whether the market is trending or stuck in a range? The "Trend or Range?" indicator is here to eliminate the guesswork by providing a structured, data-driven analysis of market conditions.
How It Works:
This indicator doesn't rely on a single metric; instead, it analyzes five core components of market behavior to provide two actionable scores: Trend Score and Range Score. Here's how each component is calculated and integrated:
1. NATR (Normalized ATR)
Purpose: Measures volatility relative to the current price. Higher values indicate active, trending markets, while lower values suggest quieter, range-bound conditions.
NATR = ATR / Close
ATR is the Average True Range over 14 periods (default setting).
2. ADX (Average Directional Index)
Purpose: Measures the strength of the trend. A higher ADX value indicates a stronger trend.
Explanation: ADX is calculated based on directional movement (+DI and -DI). It highlights the strength of the trend, regardless of direction.
3. Slope
Purpose: Tracks the rate of change in price over a fixed period (14 by default) to identify momentum strength. A steeper slope indicates stronger trends.
Slope = abs((Close - Close[14]) / 14)
This measures the absolute price change over 14 bars, normalized by time.
4. RSI Stability
Purpose: Measures the consistency of the RSI (Relative Strength Index) over time, highlighting mean-reverting behavior.
RSI Stability = stdev(RSI, 14)
This calculates the standard deviation of RSI values over 14 periods.
5. Deviation Index
Purpose: Quantifies the price's deviation from its 14-period simple moving average (SMA). This highlights overextension, which is common in range-bound markets.
Deviation Index = (Close - SMA(14)) / SMA(14)
Positive values indicate price above the SMA, while negative values show it below.
Scoring System
Trend Score Calculation
The Trend Score is a weighted sum of metrics that favor trending markets:
30% NATR: High volatility is a hallmark of trends.
30% ADX: A proven measure of trend strength.
40% Slope: Directly measures momentum.
Trend Score = (0.3 * NATR) + (0.3 * ADX) + (0.4 * Slope)
Range Score Calculation
The Range Score emphasizes mean-reverting behavior:
40% RSI Stability: Captures consistent RSI values common in ranges.
40% Inverse NATR: Low volatility favors range-bound markets.
20% Deviation Index: Measures overextension from the mean.
Range Score = (0.4 * RSI Stability) + (0.4 * (1 / NATR)) + (0.2 * Deviation Index)
What You See on the Chart
Table Display: A user-friendly table appears on the chart, showing:
- Real-time values of all five metrics.
- Calculated Trend and Range Scores.
- Color-coded signals:
- Green for dominant Trend Score.
- Red for dominant Range Score.
- Data Plots: Each metric is plotted in the data window for further analysis.
Script protetto
Questo script è pubblicato come codice protetto. Tuttavia, è possibile utilizzarle liberamente e senza alcuna limitazione – ulteriori informazioni qui.
🔥Get the Cyatophilum Indicators today and automate them on Binance! => blockchainfiesta.com/strategies/
Discord Server: discord.gg/RVwBkpnQzm
I am taking PineScript Commissions ✔
=> blockchainfiesta.com/contact/
Discord Server: discord.gg/RVwBkpnQzm
I am taking PineScript Commissions ✔
=> blockchainfiesta.com/contact/
Declinazione di responsabilità
Le informazioni e le pubblicazioni non sono intese come, e non costituiscono, consulenza o raccomandazioni finanziarie, di investimento, di trading o di altro tipo fornite o approvate da TradingView. Per ulteriori informazioni, consultare i Termini di utilizzo.