OPEN-SOURCE SCRIPT
Dual Bollinger Bands (20 & 200)
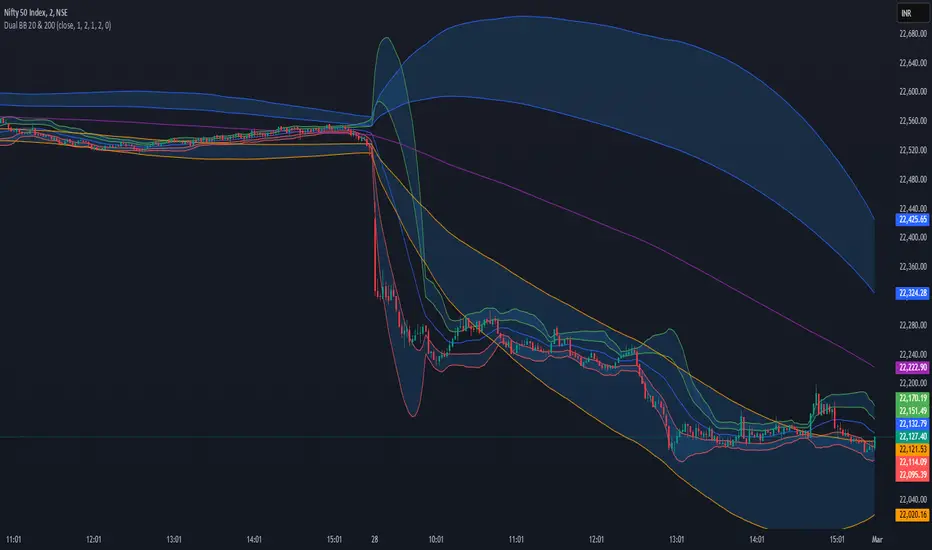
Dual Bollinger Bands (20 & 200) - Enhanced Trading Strategy
Overview
The Dual Bollinger Bands (20 & 200) indicator is an enhanced version of the Double Bollinger Bands by Alixnet. This advanced tool integrates two sets of Bollinger Bands with 20-period (short-term) and 200-period (long-term) moving averages, helping traders identify market trends, volatility, and potential trade setups more effectively.
Key Features
✅ Two Bollinger Band Sets – Short-term (20-period) and Long-term (200-period).
✅ Enable/Disable Each BB – Customize visibility for better analysis.
✅ Multiple Standard Deviations – Identify different levels of volatility.
✅ Background Fill for Clarity – Highlights volatility zones.
How to Use This Indicator Effectively
1. Understanding the Two Bollinger Bands
BB1 (20-Period): Measures short-term price movements and volatility.
BB2 (200-Period): Acts as a long-term trend filter to determine the dominant trend.
2. Trade Entries & Exits
Bullish Trade Setup (Long Entry)
🔹 Price Above 200 MA Basis Line (BB2) – Confirms an uptrend.
🔹 Price Pulls Back to the Lower Band of BB1 (20 MA) – Ideal buy opportunity.
🔹 Confirmation: If price bounces off the lower BB1 band and moves back toward the midline or upper band, enter a long position.
🔹 Exit: When price touches or exceeds the upper BB1 band.
Bearish Trade Setup (Short Entry)
🔹 Price Below 200 MA Basis Line (BB2) – Confirms a downtrend.
🔹 Price Pulls Back to the Upper Band of BB1 (20 MA) – Ideal short opportunity.
🔹 Confirmation: If price gets rejected at the upper BB1 band and moves downward, enter a short position.
🔹 Exit: When price reaches or drops below the lower BB1 band.
3. Avoiding Sideways Markets
❌ Avoid trading when price stays between the two bands of BB1 without breaking out.
❌ Flat 200 MA Line (BB2 Basis) indicates a ranging market – best to wait for a breakout.
✅ Wait for Price to Cross the 200 MA Basis Line to confirm trend direction before entering trades.
4. Catching Trending Moves
✅ Strong Trend Confirmation: When price stays above or below the 20-period BB bands and also above/below the 200-period MA.
✅ Trend Continuation: If price consolidates near the upper or lower bands without breaking opposite levels.
✅ Breakout Confirmation: Look for a candle close outside BB1 bands with momentum to confirm strong moves.
Final Thoughts
The Dual Bollinger Bands (20 & 200) indicator is a powerful tool for both short-term traders and long-term investors. By combining the short-term volatility of the 20-period BB with the long-term trend of the 200-period BB, traders can make more informed trading decisions, filter out noise, and capture high-probability trade setups.
Script open-source
Nello spirito di TradingView, l'autore di questo script lo ha reso open source, in modo che i trader possano esaminarne e verificarne la funzionalità. Complimenti all'autore! Sebbene sia possibile utilizzarlo gratuitamente, ricordiamo che la ripubblicazione del codice è soggetta al nostro Regolamento.
Declinazione di responsabilità
Le informazioni e le pubblicazioni non sono intese come, e non costituiscono, consulenza o raccomandazioni finanziarie, di investimento, di trading o di altro tipo fornite o approvate da TradingView. Per ulteriori informazioni, consultare i Termini di utilizzo.