OPEN-SOURCE SCRIPT
Tradytics Levels with EMA Cloud
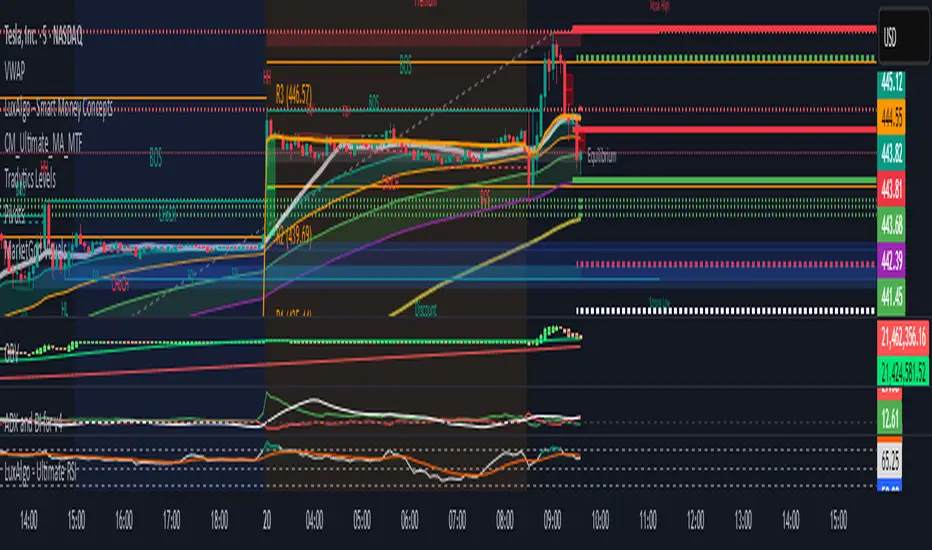
This indicator has tradytics price chart levels where you can put in the input code seen below.
The code has positive gamma (green lines), negative gamma (Red lines) and white dotted line are the darkpool levels.
This is Amazon's 5 minute from Sep30th to October 20th Gammas and weekly Darkpool levels. Just copy and paste code below in the input code and the chart would show the levels.
212.8*1*neutral 220.07*1*neutral 216.038*1*neutral 215.57*1*neutral 219.988*1*neutral 217.401*1*neutral 217.351*1*neutral 212.815*1*neutral 212.75*1*neutral 212.4*1*neutral 215*0*negative 222.5*0*positive 217.5*0*positive 220*0*positive
Script open-source
Nello spirito di TradingView, l'autore di questo script lo ha reso open source, in modo che i trader possano esaminarne e verificarne la funzionalità. Complimenti all'autore! Sebbene sia possibile utilizzarlo gratuitamente, ricordiamo che la ripubblicazione del codice è soggetta al nostro Regolamento.
Declinazione di responsabilità
Le informazioni e le pubblicazioni non sono intese come, e non costituiscono, consulenza o raccomandazioni finanziarie, di investimento, di trading o di altro tipo fornite o approvate da TradingView. Per ulteriori informazioni, consultare i Termini di utilizzo.