OPEN-SOURCE SCRIPT
Aggiornato level_stats
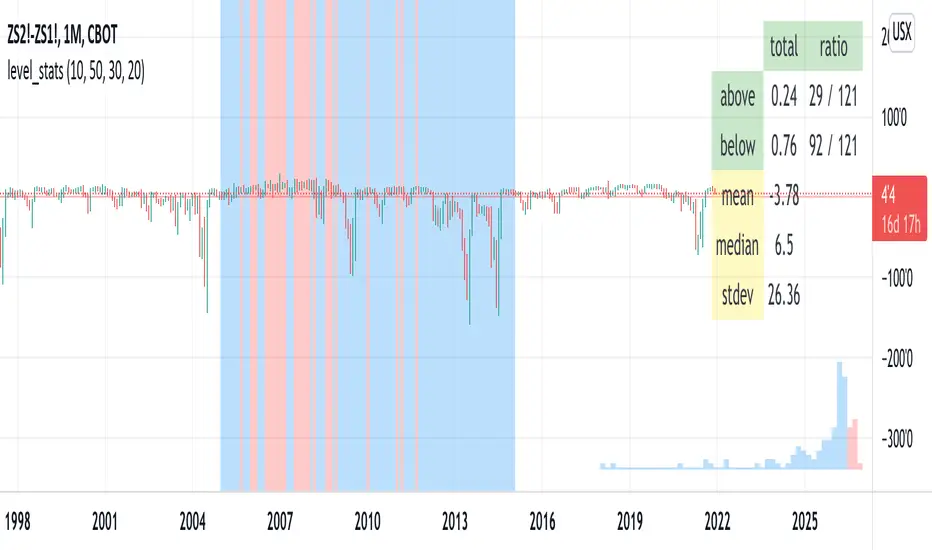
This script tells you the percentage of time an instrument's closing value is above and below a level of your choosing. The background color visually indicates periods where the instrument closed at or above the level (red) and below it (blue). For "stationary-ish" processes, you can get a loose feel for the mean, high, and low values. The historical information conveyed through the background coloring can help you plan derivatives trades. Try with your favorite pairs, commodities, or volatility indices.
Usage: pick a level of interest using the input.
Usage: pick a level of interest using the input.
Note di rilascio
Added a histogram to depict the distribution of closing prices. Prices less than the "level" input are blue, while those above the level are red. This color scheme is also used to color the chart background.Note di rilascio
removed some debug codeNote di rilascio
added mean, median, and stdevNote di rilascio
Added a date selection. The statistics and histogram will reflect only the period [ start, end ).Note di rilascio
added a horizontal line (light red) to indicate the levelNote di rilascio
The histogram's width, height, and number of buckets are now adjustable inputs. More buckets will make the histogram somewhat smoother and more detailed, but at the cost of performance. The maximum number of buckets is probably around 80. The width and height units are "percentage of the screen".I have set the defaults at levels that perform reasonably well.
Script open-source
Nello spirito di TradingView, l'autore di questo script lo ha reso open source, in modo che i trader possano esaminarne e verificarne la funzionalità. Complimenti all'autore! Sebbene sia possibile utilizzarlo gratuitamente, ricordiamo che la ripubblicazione del codice è soggetta al nostro Regolamento.
Declinazione di responsabilità
Le informazioni e le pubblicazioni non sono intese come, e non costituiscono, consulenza o raccomandazioni finanziarie, di investimento, di trading o di altro tipo fornite o approvate da TradingView. Per ulteriori informazioni, consultare i Termini di utilizzo.