OPEN-SOURCE SCRIPT
Aggiornato Ichimoku Peeks
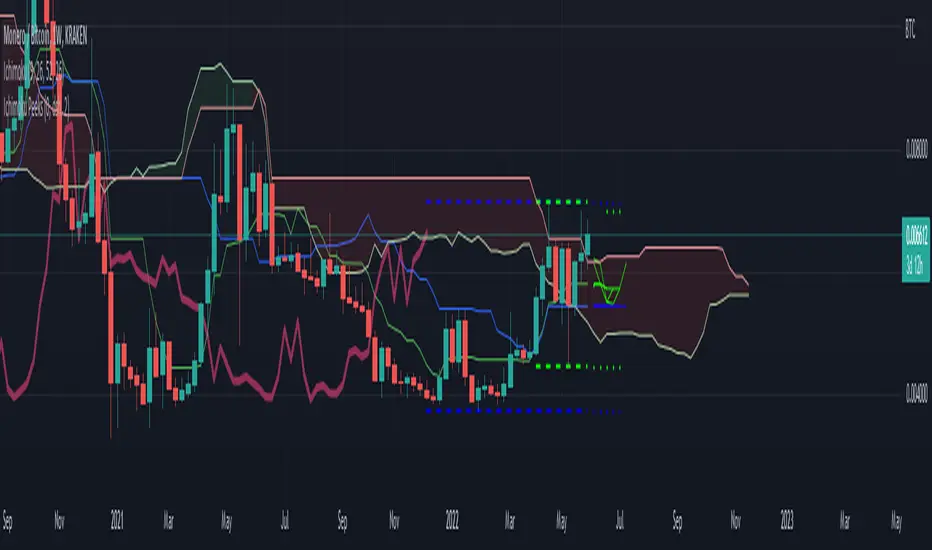
This indicator uses the Ichimoku Tenkan / Kijun trend line formulas to predict what those values will be in the future if current price action does not violate the period highs and lows.
Because of the way Ichimoku formulates the trend, it contains (but does not visualize) this predictive information in a way that moving averages do not.
Sharp chart readers can infer upcoming changes by counting back candles, but the process can be automated, as I've shown here.
This description does not seem to be editable so implementation details and usage will be covered in code commentary.
Note di rilascio
* Fixed first prediction not rendering in some configs.* Added input boundary lines to show where calculation data is pulled from (off by default).
* Minor config organization.
Note di rilascio
* Bugfix for visual artifacts. History of first projection was displayed in simple mode as infinite cross tail.* Adjusted "input boundary" diagnostic so that it more coherently relates to the projections. Now first projection drops last candle in channel.
Note di rilascio
In this update:* More code commentary about usage and theory.
* Input boundaries are now on by default and configurable.
* Input boundaries are extended by default into projected range via `Show Highs/Lows` option.
Note di rilascio
* Minor comment update to replace preview chart.Note di rilascio
Documentation and preview update.Note di rilascio
* Added built in Ichimoku via (lib-hlm)* Removed later projections due to less confidence and to make room for Ichimoku.
* Documentation updates.
* Option to fill in the boundary zones.
Script open-source
Nello spirito di TradingView, l'autore di questo script lo ha reso open source, in modo che i trader possano esaminarne e verificarne la funzionalità. Complimenti all'autore! Sebbene sia possibile utilizzarlo gratuitamente, ricordiamo che la ripubblicazione del codice è soggetta al nostro Regolamento.
Declinazione di responsabilità
Le informazioni e le pubblicazioni non sono intese come, e non costituiscono, consulenza o raccomandazioni finanziarie, di investimento, di trading o di altro tipo fornite o approvate da TradingView. Per ulteriori informazioni, consultare i Termini di utilizzo.