OPEN-SOURCE SCRIPT
Bollinger Bands & SuperTrend Strategy by Tradinggg Hub
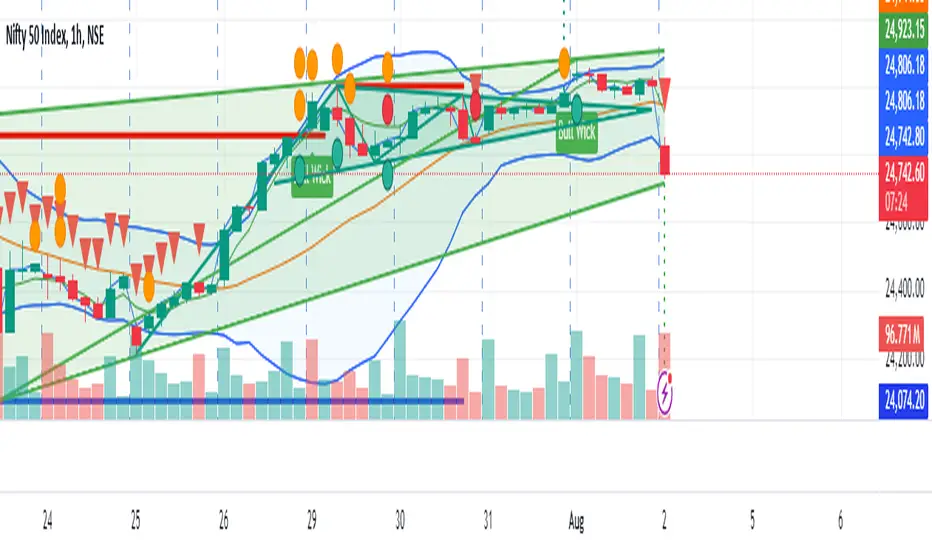
This TradingView Pinescript combines Bollinger Bands and a custom SuperTrend indicator to generate trading signals.
Bollinger Bands:
Bollinger Bands are a popular volatility indicator that consists of three lines:
* Basis: A simple moving average (SMA) of the price (default length is 20 periods).
* Upper Band: The basis plus a standard deviation multiplier (default is 2).
* Lower Band: The basis minus a standard deviation multiplier (default is 2).
These bands expand and contract as volatility increases or decreases, helping traders identify potential overbought and oversold conditions.
SuperTrend:
The SuperTrend indicator is a trend-following tool that aims to identify the direction of the price trend. It uses the Average True Range (ATR) to determine the volatility of the market and sets levels above and below the price to indicate potential trend reversals.
How the Strategy Works:
1. Bollinger Bands: The script plots Bollinger Bands around the price, providing insight into the current volatility and potential overbought or oversold conditions.
2. SuperTrend: The script calculates and plots a custom SuperTrend indicator based on user-defined ATR period and factor. It helps visualize the current trend direction and potential trend reversals.
3. Buy Signals: A buy signal is generated when the following conditions are met:
- The price crosses above the SuperTrend line.
- The price is above the Bollinger Bands basis line.
4. Sell Signals: A sell signal is generated when one of the following conditions is met:
- The price crosses below the SuperTrend line.
- The price is below the Bollinger Bands basis line.
Key Parameters:
* Bollinger Bands Length: The number of periods used to calculate the basis (SMA) of the Bollinger Bands.
* Bollinger Bands Multiplier: The factor used to calculate the standard deviation for the upper and lower bands.
* SuperTrend ATR Period: The number of periods used to calculate the Average True Range (ATR) for the SuperTrend.
* SuperTrend Factor: The factor used to determine the distance of the SuperTrend levels from the price.
Customization:
Feel free to experiment with different parameter values to optimize the strategy for your preferred asset and time frame.
Disclaimer:
This script is intended for educational and informational purposes only. It should not be considered as financial advice. Always conduct thorough research and consider your own risk tolerance before making any trading decisions.
Script open-source
Nello spirito di TradingView, l'autore di questo script lo ha reso open source, in modo che i trader possano esaminarne e verificarne la funzionalità. Complimenti all'autore! Sebbene sia possibile utilizzarlo gratuitamente, ricordiamo che la ripubblicazione del codice è soggetta al nostro Regolamento.
Declinazione di responsabilità
Le informazioni e le pubblicazioni non sono intese come, e non costituiscono, consulenza o raccomandazioni finanziarie, di investimento, di trading o di altro tipo fornite o approvate da TradingView. Per ulteriori informazioni, consultare i Termini di utilizzo.