PROTECTED SOURCE SCRIPT
EMA50 Z-Score Indicator
EMA50 Z-Score Indicator
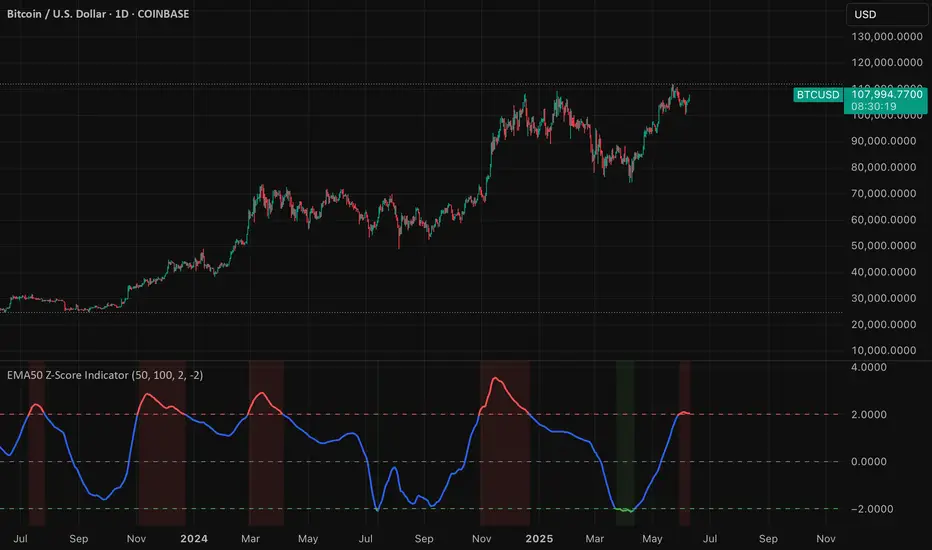
The EMA50 Z-Score Indicator is a quantitative tool that standardizes the behavior of the 50-period Exponential Moving Average (EMA) using statistical normalization. It measures how far the current EMA50 deviates from its recent historical average in terms of standard deviations, offering a probabilistic lens into trend extension and potential reversion zones.
Purpose
Traditional moving averages provide directional trend data but lack statistical context. This indicator addresses that by applying a Z-Score transformation to the EMA50, which allows traders to assess whether the trend is overextended—either to the upside or downside—relative to its own recent history.
Methodology
The indicator calculates the Z-Score using the following formula:
Z = (EMA50 - SMA of EMA50) / Standard Deviation of EMA50
The Z-Score is computed over a user-defined lookback period (default: 100 periods), allowing it to adapt to various market conditions while preserving statistical validity.
Interpretation
Overbought Conditions: When the Z-Score exceeds a predefined positive threshold (e.g., +1.25 or +2.0), the EMA50 is statistically extended to the upside. This may indicate elevated trend momentum or exhaustion, depending on context.
Oversold Conditions: When the Z-Score falls below a predefined negative threshold (e.g., −1.25 or −2.0), the EMA50 is compressed relative to its norm, potentially signaling undervaluation or capitulation.
Neutral Conditions: A Z-Score near zero indicates that the EMA50 is near its historical average, suggesting the trend is behaving within expected bounds.
Script protetto
Questo script è pubblicato come codice protetto. Tuttavia, è possibile utilizzarle liberamente e senza alcuna limitazione – ulteriori informazioni qui.
Declinazione di responsabilità
Le informazioni e le pubblicazioni non sono intese come, e non costituiscono, consulenza o raccomandazioni finanziarie, di investimento, di trading o di altro tipo fornite o approvate da TradingView. Per ulteriori informazioni, consultare i Termini di utilizzo.