OPEN-SOURCE SCRIPT
Aggiornato Initial Balance (IB) and Previous Day / Week High, Low & Close
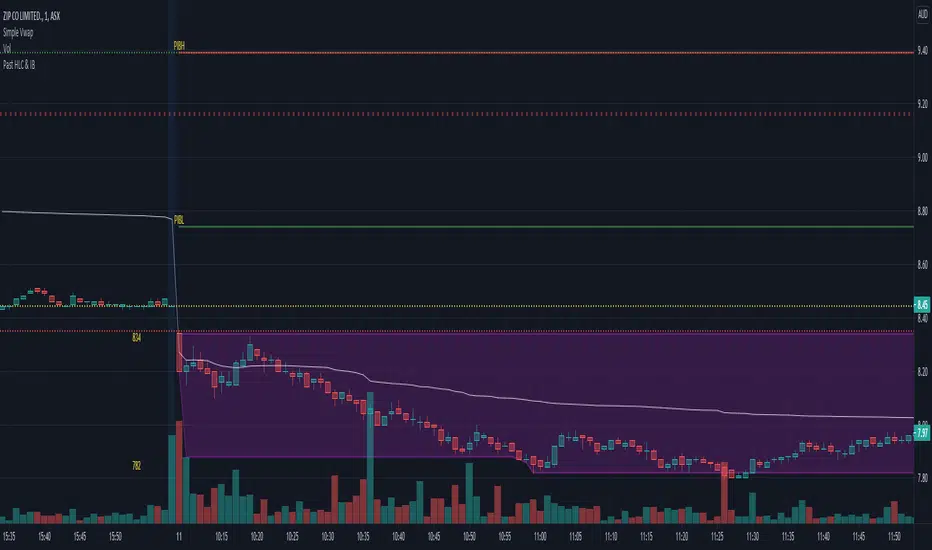
Plots Historical key levels for volume profile idea.
Plots the following:
- Previous Day High
- Previous Day Low
- Previous Day Close
- Previous Day IB High
- Previous Day IB Low
- Current Days IB High
- Current Days IB Low
IB is based on first hour of trading.
Made specifically for ASX stocks, have not tested it on other exchanges or assets.
Plots the following:
- Previous Day High
- Previous Day Low
- Previous Day Close
- Previous Day IB High
- Previous Day IB Low
- Current Days IB High
- Current Days IB Low
IB is based on first hour of trading.
Made specifically for ASX stocks, have not tested it on other exchanges or assets.
Note di rilascio
Fixed bugsThe indicator will now create a IB area for the current day, and shade it, and store details of previous days IB session and display it as a plot line.
Historical IB's can be switched on and viewed via settings.
IB session length can be altered in the settings.
Note di rilascio
Just updated how high and low is sourced for IB so that its real price, and is not effected by changing to Heikin ashi candles, or others. Note di rilascio
updated error in IB being updated all day rather than just IB time. Note di rilascio
Updated and cleaned up the IB indicatorScript open-source
In pieno spirito TradingView, il creatore di questo script lo ha reso open-source, in modo che i trader possano esaminarlo e verificarne la funzionalità. Complimenti all'autore! Sebbene sia possibile utilizzarlo gratuitamente, ricorda che la ripubblicazione del codice è soggetta al nostro Regolamento.
Declinazione di responsabilità
Le informazioni ed i contenuti pubblicati non costituiscono in alcun modo una sollecitazione ad investire o ad operare nei mercati finanziari. Non sono inoltre fornite o supportate da TradingView. Maggiori dettagli nelle Condizioni d'uso.
Script open-source
In pieno spirito TradingView, il creatore di questo script lo ha reso open-source, in modo che i trader possano esaminarlo e verificarne la funzionalità. Complimenti all'autore! Sebbene sia possibile utilizzarlo gratuitamente, ricorda che la ripubblicazione del codice è soggetta al nostro Regolamento.
Declinazione di responsabilità
Le informazioni ed i contenuti pubblicati non costituiscono in alcun modo una sollecitazione ad investire o ad operare nei mercati finanziari. Non sono inoltre fornite o supportate da TradingView. Maggiori dettagli nelle Condizioni d'uso.