Live Price Watermark (Flashing Overlay)Displays the current price as a large, centered watermark directly on your chart. The text color updates dynamically:
- Green when price rises
- Red when price falls
- Translucent black when unchanged
Close

MaxEvolved Japanese CloseShow the closing price of the Japanese candle. Usefull with Heiken Ashi.
Afficher le prix de fermeture de la chandelle japonaise. Utile pour Heiken Ashi.

Smart % Levels📈 Smart % Levels – Visualize Significant Percentage Moves
What it does:
This indicator plots horizontal levels based on a percentage change from the previous day's close (or open, if selected). It allows traders to visualize price movements relative to meaningful thresholds like ±1%, ±2%, etc.
What makes it different:
Unlike other level indicators, Smart % Levels only displays the relevant levels based on current price action. This avoids clutter by showing only the levels that are being approached or crossed by the current price. It's a clean and dynamic way to visualize key price zones for intraday analysis.
How it works:
- Select between using the previous day's Close or Open as the reference
- Choose the percentage spacing between levels (e.g., 1%, 0.5%, etc.)
- Enable optional labels to see the exact percentage of each level
- Automatically filters levels to only show those between yesterday's price and today's current price
- Includes customization for colors, line styles, widths, and opacity
Best for:
Day traders and scalpers who want a quick, clean view of how far the current price has moved from yesterday’s reference, without being overwhelmed by unnecessary lines.
Extra notes:
- The levels are recalculated each day at the market open
- All graphics reset at the start of each session to maintain clarity
- This script avoids repainting by only plotting levels relative to available historical data (no lookahead)
This tool is for informational purposes only and should not be considered as financial advice. Always do your own research before making trading decisions.

JL - DWM OHLCThis indicator plots the following price levels on your chart automatically AND will not show up if you are using a timeframe bigger than 60 minutes, 1 day, or 1 week.
Here are the price levels that are automatically plotted for you, and so you know the styling is different for Daily, Weekly, Monthly levels so you can easily distinguish between them:
- Prior Day: High / Low / Close
- Current Day: Open
- Prior Week: High / Low / Close
- Current Week: Open
- Prior Month: High / Low / Close
- Current Month: Open
These plots are timeframe dependent and will not plot on subsequently higher timeframes, here is how they work:
Daily Price Levels are only shown on timeframes that are smaller than 60 minutes.
Weekly Price Levels are only shown on timeframes smaller than 1 Day.
Monthly Price Levels are only shown on timeframes smaller than 1 Week.
This way, you can turn on the indicator and not have to think about turning off certain price levels if you switch to a larger / longer timeframe than what you typically use.
For example, Daily OHLC price levels will quickly clutter the 60 minute chart, and likely you don't need to know the HLC of the Prior Day if you are looking at the 60 minute chart. Therefor it may be helpful to automatically hide the Daily price level plots, and only show the Weekly and Monthly plots on the 60 minute timeframe.
I hope you find this indicator helpful, thanks for reading.

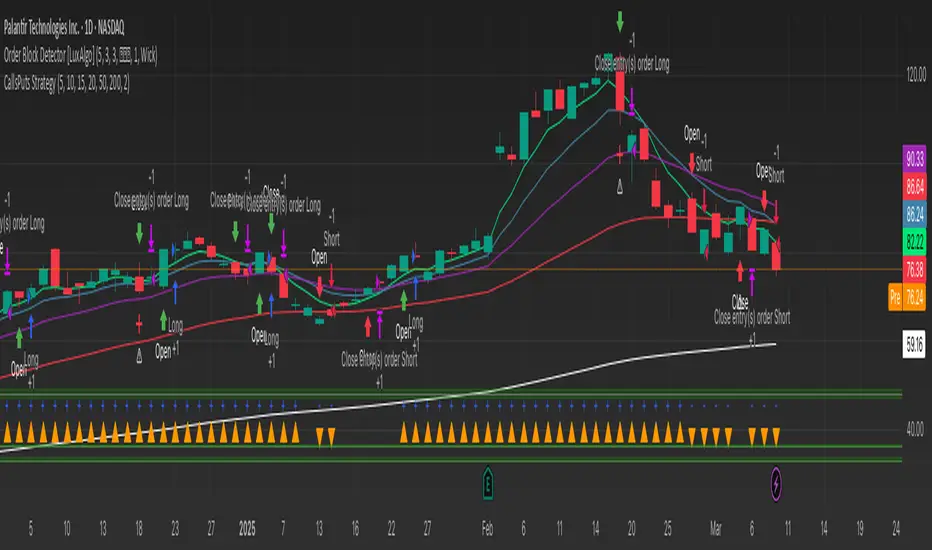
GRIM309 CallPut StrategyThis draws the 5, 10, 20, 50 and 200 EMA lines.
It creates suggestions of when to open and close call positions (GREEN) as well as open and close put positions (RED) it has a early warning system, and in case there is a spike between the last 5 positions it will signal close the position, this is optional (isWarning)
There is also a cooldown period, when set at 2 it means wait a position before initiating another, I did not like the position closing and then opening directly afterwards, you could cooldown for 3 and skip 2 candles or more etc. Set to 1 then it will open/close without cooling down.
Additionally the very bottom shows wether it is in an uptrend or downtrend currently (Yellow triangle)
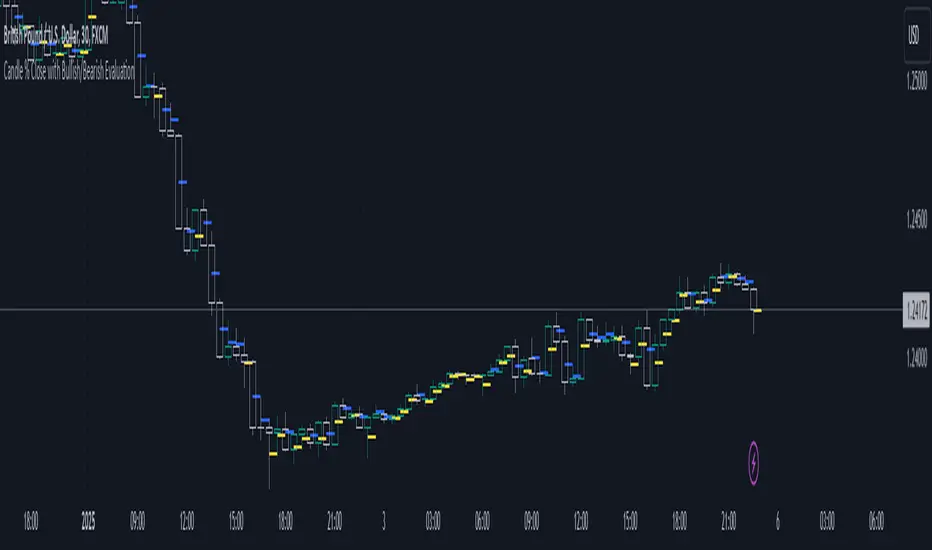
Candle % Close with Bullish/Bearish EvaluationI created the indicator to more quickly define the polarity of candles. For a large number of candles, it is straightforward to determine whether a candle is bullish or bearish. However, candles with long wicks often appear, making it uncertain whether the candle is bullish or bearish from a price action perspective. It is not a rule that a red candle is bearish and a green candle is bullish.
From a more advanced price action standpoint, how these candles close is important. Therefore, I created the 'Percent range' input. By default, it is set to 50% (high-low)/2. This way, the indicator precisely determines 50% of the candle's entire range. This allows us to determine whether a bearish candle truly closed below 50% of its range. If not, such a candle is considered bullish, even if it is a negative candle. The same applies to bullish candles, but conversely. If a positive candle closes below 50% of its range, from a price action perspective, it is considered a bearish candle.
Since in price action it is common for the price to return to 50% of the previous candle and, after filling, to continue in the established trend, I added the line extension option. Whatever high value you enter, the line extension follows the current candle. This option works only when the stop line checkbox is enabled. This way, you can plot 50% of the candle's range that the market has historically not returned to due to a strong trend. Often, this line is plotted on a candle where there is also an FVG, which can help you more easily find a point of interest.
Stop line extension : Ensures the interruption of line plotting when the candle is touched by the body or wick.
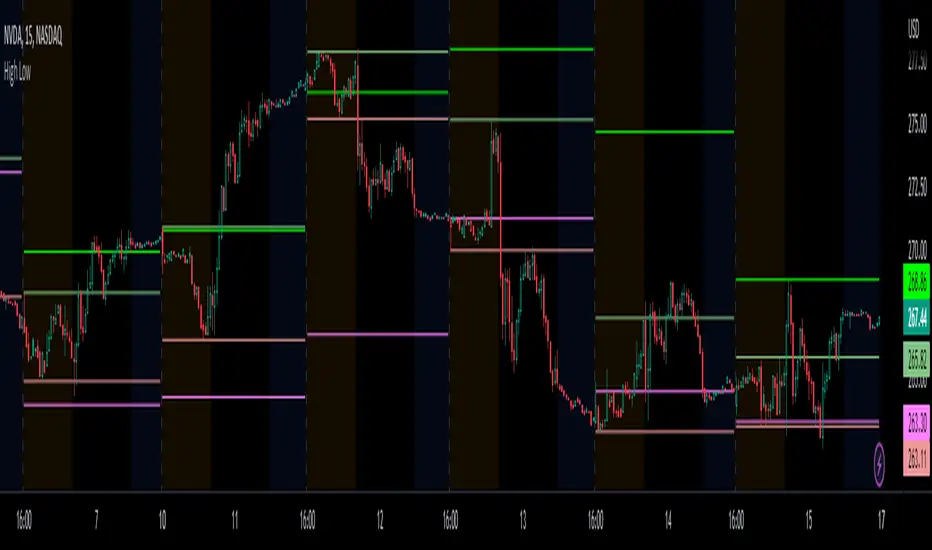
Previous Highs + Lows by HAZED📈 Introducing: Previous Highs + Lows by H A Z E D 📉
✨ Overview
Get a clear view of market levels with Previous Highs + Lows v1.0! This indicator lets you track critical previous highs and lows across multiple timeframes, marking them directly on your chart for an intuitive view of support and resistance zones. Whether you’re analyzing breakouts or looking for reversal levels, these indicators provide essential context to refine your trades.
🛠️ Key Features
Multiple Timeframes Supported
Toggle on previous highs and lows for daily, weekly, monthly, 4-hour, and 1-hour charts to match your analysis style.
Customizable Labels
Choose label sizes from “tiny” to “huge,” adjust the opacity to blend seamlessly with your chart, and customize text color for optimal readability.
Label Position Control
Avoid overlap with a flexible label offset feature, allowing for 10 adjustable increments to fit your preference and chart layout.
Clear Visual Cues
Labels use icons to differentiate high (⬆️) and low (⬇️) levels at a glance, providing a straightforward way to interpret key price areas.
Instant Alerts for Key Levels
Receive alerts when the price crosses over previous high levels, keeping you informed about potential breakout zones without constant chart-watching.
🚀 How to Use
Identify Key Levels: Quickly locate significant highs and lows from previous periods to define your support and resistance zones.
Set Alerts: Stay updated on market moves with built-in alerts when prices cross these critical levels.
Customize Your View: Use the various options to make this indicator uniquely yours – adjust label size, color, opacity, and position.
🔔 Why Use Previous Highs + Lows v1.0?
Enhanced visibility of critical levels saves you time by giving you a structured view of price action.
Customization features let you adapt the indicator to your personal style and chart setup.
Flexible alerts mean you can focus on other tasks without missing important price movements.
🔗 License: Mozilla Public License 2.0
© H A Z E D, 11/4/2024

[TTI] High Volume Close (HVC) Setup📜 ––––HISTORY & CREDITS––––
The High Volume Close (HVC) Setup is a specialised indicator designed for the TradingView platform used to identify specific bar. This tool was developed with the objective of identifying a technical pattern that trades have claimed is significant trading opportunities through a unique blend of volume analysis and price action strategies. It is based on the premise that high-volume bars, when combined with specific price action criteria, can signal key market movements.
The HVC is applicable both for swing and longer term trading and as a technical tool it can be used by traders of any asset type (stocks, ETF, crypto, forex etc).
🦄 –––UNIQUENESS–––
The uniqueness of the HVC Setup lies in its flexibility to determine an important price level based on historically important bar. The idea is to identify significant bars (e.g. those who have created the HIGHEST VOLUME: Ever, Yearly, Quarterly and meet additional criteria from the settings) and plot on the chart the close on that day as a significant level as well as theoretical stop loss and target levels. This approach allows traders to discern high volume bars that are contextually significant — a method not commonly found in standard trading tools.
🎯 ––––WHAT IT DOES––––
The HVC Setup indicator performs a series of calculations to identify high volume close bars/bar (HVC bars) based on the user requirements.
These bars are determined based on the highest volume recorded within a user-inputs:
👉 Period (Ever, Yearly, Quarterly) and must meet additional criteria such as:
👉 a minimum percentage Price Change (change is calculated based on a close/close) and
👉 specific Closing Range requirements for the HVC da.
The theory is that this is a significant bar that is important to know where it is on the chart.
The script includes a comparative analysis of the HVC bar's price against historical price highs (all-time, yearly, quarterly), which provides further context and significance to the identified bars. All of these USER input requirement are then taken into account as a condition to identity the High Volume Close Bar (HVC).
The visual representation includes color-coded bar (default is yellow) and lines to delineate these key trading signals. It then draws a blue line for the place where the close ofthe bar is, a red line that would signify a stop loss and 2 target profit levels equal to 2R and 3R of the risked level (close-stop loss). Additional lines can be turned on/off with their coresponding checkboxes in the settings.
If the user chooses "Ever" for Period - the script will look at the first available bar ever in Tradingview - this is generally the IPO bar;
If the users chooses "Yearly" - the script would look at the highest available bar for a completed year;
If the users chooses "Quarterly" - it would do the same for the quarter. (works on daily timeframe only);
While we have not backtested the performance of the script, this methodology has been widely publicised.
🛠️ ––––HOW TO USE IT––––
To utilize the HVC Setup effectively:
👉Customize Input Settings: Choose the HVC period, percentage change threshold, closing range, stop loss distance, and target multiples according to your trading strategy. Use the tick boxes to enable and disable if a given condition is used within the calculation.
👉Identify HVC Bars: The script highlights HVC bars, indicating potential opportunities based on volume and price action analysis.
👉Interpret Targets and Stop Losses: Use the color-coded lines (green for targets, red for stop losses) to guide your trade entries and exits.
👉Contextual Analysis: Always consider the HVC bar signals in conjunction with overall market trends and additional technical indicators for comprehensive trading decisions.
This script is designed to assist traders in identifying high-potential trading setups by using a combination of volume and price analysis, enhancing traditional methods with a unique, algorithmically driven approach.

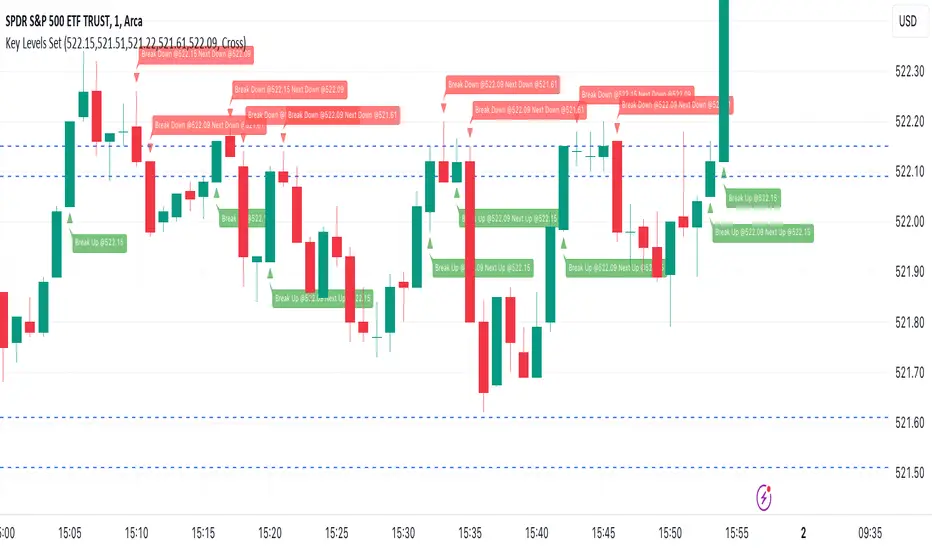
Key Levels SetKey Levels Set allows to set key levels as comma separated values, and to detect breaks to the downside and/or upside, taking into account potential gaps between bars.
This indicator can be very handy if you, like me, rely on some key levels that you identified as potential support/resistance from some technical analysis.
Features
+ It allows for key levels to be set as comma separated values.
+ It draws key levels on chart.
+ On close, it identifies highest key level that has been broken to the upside, if any.
+ On close, it identifies lowest key level that has been broken to the downside, if any.
+ In Cross mode, as bar is printing, it also detects highest/lowest key levels being broken to the upside/downside between bar high and low, if any.
+ It plots and labels breaks with current level and next level information.
+ It includes alerts from breaks on close.
+ It includes turn on/off functionality.
Settings
+ {Prices} checkbox: turns on/off entire functionality
+ {Prices} text field: comma separated values for key levels
+ {Breaks on} checkbox: turns on/off breaks detection functionality
+ {Breaks on} options: selects Close or Cross mode
Alert on Candle CloseAlert on Candle Close is a simple indicator allowing you to set alerts when a candlestick closes.
Instructions for use
From the chart window, click on "Indicators" and search for "Alert on Candle Close".
Click on "Alert on Candle Close" to add the indicator to your chart. Click on the star icon to add it to your favourites to easily access later.
Set your chart timeframe to the timeframe you wish to alert on. For example, to create an alert when a 4h candlestick closes, set your chart to the "4h" timeframe.
Hover over the "Alert on Candle Close" indicator which has been added to your chart and click the ellipsis "..." icon, then click "Add alert on Alert on Candle Close" or use the keyboard shortcut "Alt+A" from the chart.
In the alert pop-up window, make sure "Condition" is set to "Alert on Candle Close" and "Trigger" is set to "Once Per Bar".
Optionally, you can set a custom expiry for the alert, give the alert a name and customise the alert message. You can configure notification settings from the "Notifications" tab.
Click "Create" and your alert is set up!
Each alert is tied to the timeframe and chart it was created on, so you can change the timeframe or asset and create more alerts by repeating the above process.
Note : this indicator is only designed to work with time-based chart types, such as Bars, Candles or Heikin Ashi. It will not work for non-time charts such as Renko.
FAQs
Why do my alerts sometimes not fire as soon as the candle closes?
This is a limitation with Pine Script's execution model. Indicators are calculated whenever a price or volume change occurs i.e. when a new trade happens. For illiquid or slow moving markets, there may be some time between when a candle closes and the next trade, leading to a delay in the alert triggering. The alert will trigger on the next tick of data on the chart.
Why can't I create more alerts?
TradingView has a limit on the number of active technical alerts you can have based on your membership tier. To configure more alerts, consider upgrading your TradingView plan to a higher tier. See a comparison of TradingView plans at www.tradingview.com
My alert only fired once, how can I get it to keep working?
When configuring the alert in the alert pop-up window, make sure you set "Trigger" to "Once Per Bar" and "Expiration" to "Open-ended alert".

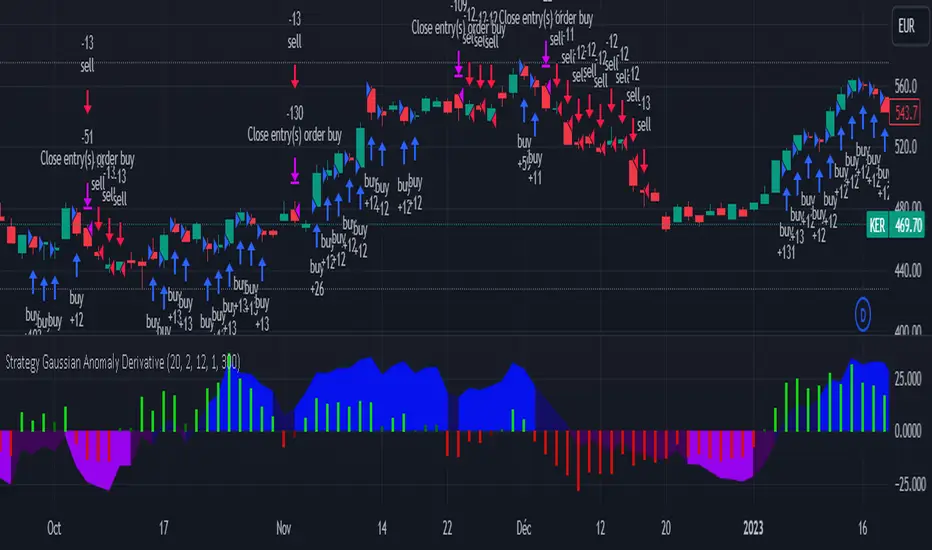
Strategy Gaussian Anomaly DerivativeConcept behind this Strategy :
Considering a normal "buy/sell" situation, an asset would be bought in average at the median price following a Gaussian like concept. A higher or lower average trend would significate that the current perceived value is respectively higher or lower than the current median price, which mean that the buyers are evaluating the price underpriced or overpriced.
This behaviour would be even more relevent depending on its derivative evolution.
Therefore, this Strategy setup is based on this Gaussian like concept anomaly of average close positionning compare to high-low average derivative, such as the derivative of the following ploted basic signal : 1-(high+low)/(2*close).
This Strategy can actually be used like a trend change and continuation strength indicator aswell.
In the Setup Signal part :
You can define the filtering of the basis signal "1-(high+low)/(2*close)" on EMA or SMA as you wish.
You can define the corresponding period and the threathold as a mutiply of the average 1/3 of all time value of the basis signal.
You can define the SMA filtering period of the Derivative signal and the corresponding threathold on the same mutiply of the average 1/3 of all time value of the derivative.
In the Setup Strategy part :
You can set up your strategy assesment based on Long and/or Short. You can also define the considered period.
The most successful tuned strategies I did were based on the derivative indicator with periods on the basis signal and the derivative under 30, can be 1 to 3 of te derivative and 7 to 21 for the basis signal. The threathold depends on the asset volatility aswell, 1 is usually the most efficient but 0 to 10 can be relevent depending on the situation I met. You can find an example of tuning for this strategy based on Kering's case hereafter.
I hoping that you will enjoy using this Strategy, don't hesitate to comment, to question, to correct or complete it ! I would be very curious about similar famous approaches that would have already been made.
Thank to you !
OHMLC Lines - Present- Current OHMLC candles
- Show current Open, High, Mid, Low, Close candles levels

50% candlestick closeThis indicator is useful at important level, when you want to see some bullish or bearish signs in candlestick.
At your important support level you can buy, if candlestick close is above 50% of its range, with low of this candlestick as SL.
At your important resistance level you can sell, if candlestick close is below 50% of its range, with high of this candlestick as SL.

Bursa Malaysia Index SeriesERVIEW
This indicator is intend to display Bursa Malaysia Index Series.
█ FEATURES
1. Choose available sector based on Bursa Malaysia Index.
2. Plot close or OHLC.
3. Color of Closing price plot adapt to chart background color.
4. Font size can be selected.
█ EXAMPLES / USAGES

Prior day and pre-market high lowThis indicator displays the:
- Prior day high
- Prior day low
- Pre-market high
- Pre-market low
as a coloured line across the entire session for each individual session on an intraday chart.
For the extended session, this indicator marks the prior day and pre-market high low for each individual session starting at the pre-market and ending in the post-market, a feature not available on other indicators.
This indicator automatically marks out the levels for the prior day and pre-market high low for each individual session, allowing the user to observe how the price action behaves around the prior day and pre-market high low.
Note:
In this script, request.security() used with lookahead = barmerge.lookahead_on to fetch prices without offsetting the series by for the extended session does not access future data. This is because for extended session, request.security() sees the start of the session to be at the start of the regular session and ends at the end of the pre-market, when in reality the session starts at the start of the pre-market and ends at the end of the post-market.
Hence in each extended session when the line is first drawn in the pre-market, request.security() returns the value of the prior day high/low, and not future data.
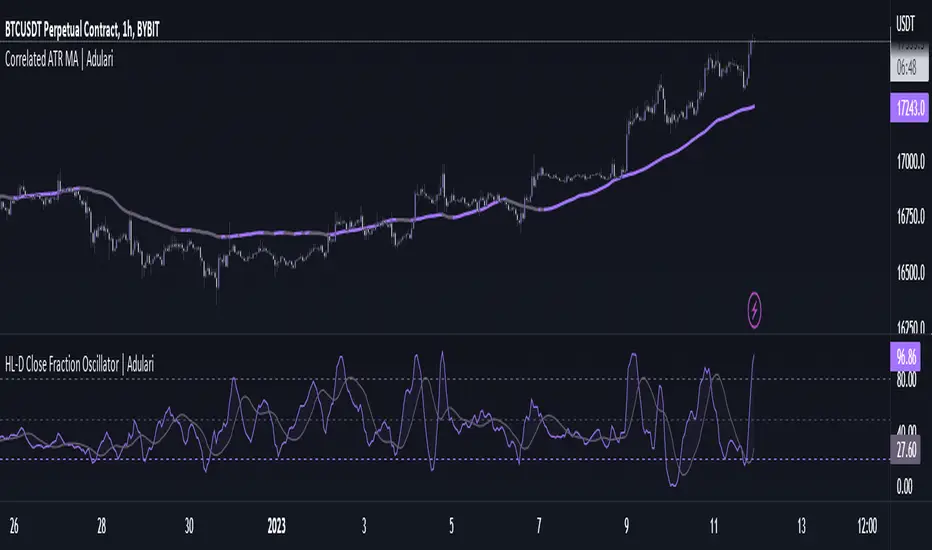
HL-D Close Fraction Oscillator | AdulariDescription:
This indicator calculates the difference between price high's and low's, and fractions it by the close price. If it calculates the difference between a high and low or low and high is defined by whether the current close is higher than the previous close. It is then also rescaled to ensure the value is always appropriate compared to the last set amount of bars.
This indicator can be used to determine whether a market is trending or ranging, and if so in which direction it is trending.
How do I use it?
Never use this indicator as standalone trading signal, it should be used as confluence.
When the value is above the middle line this shows the bullish trend is strong.
When the value is below the middle line this shows the bearish trend is strong.
When the value crosses above the upper line this indicates the trend may reverse downwards.
When the value crosses below the lower line this indicates the trend may reverse upwards.
When the value crosses above the signal this indicates the current bearish trend is getting weak and may reverse upwards.
When the value crosses below the signal this indicates the current bullish trend is getting weak and may reverse downwards.
Features:
Oscillator value indicating the difference between highs and lows fractioned by the close price.
Signal indicating a clear trend and base line value.
Horizontal lines such as oversold, overbought and middle lines, indicating possible interest zones.
How does it work?
1 — Define trend by checking if current close is above or below previous close.
2 — If the current close is above the previous close, calculate the oscillator's value using this formula:
(high - low) / close
2 — If the current close is below the previous close, calculate the oscillator's value using this formula:
(low - high) / close
3 — Smooth the original value using a specified moving average.
4 — Rescale the value using this formula:
newMin + (newMax - newMin) * (value - oldMin) / math.max(oldMax - oldMin, 10e-10)
5 — Calculate signal value by applying smoothing to the oscillator's value.
OHLC ToolOHLC Tool allows you to display Current or Historical OHLC Values as horizontal lines that extend to the right on your chart.
Features
Variable Lookback to display a specific historical bar's values. Default = 1 (Previous Candle)
Customizable Timeframe to view HTF Candle values.
Custom Line Colors, Styles, and Thicknesses.
Price Scale Value Display Capability.
For displaying the line values and labels on the price scale you will need to enable:
"Indicator and financials name labels"
and
"Indicator and financials value labels"
These options are found in the Price Scale Menu under Labels. Price Scale Menu > Labels
When you do this you will notice your other indicator values will also be on the price scale,
if you wish to disable these, go to the indicator settings under the "Style" Tab, Uncheck the "Labels on price scale" box.
Indicator Settings > Style > "Labels on price scale"
Enjoy!

Line Chart with circles on sub chart / LineChart no CandlesLine Chart with circles as a subchart. The circle will appear only after the candle has been confirmed.
Things you can change:
- Source: open, high, low, close, hl2, hlc3, ohlc4, hlcc4
- Color: change the color of the line and the circles
have fun with it!

Range Gap/Open to Close/Close to CloseThis indicator shows the percentage variation of:
gap
close to close (day including gap)
open to close (without gap)
The green bars represent the days when the variation did not reach the selected range. The red bars show the days when the variation was higher than the selected range.
Best timeframe : DAY

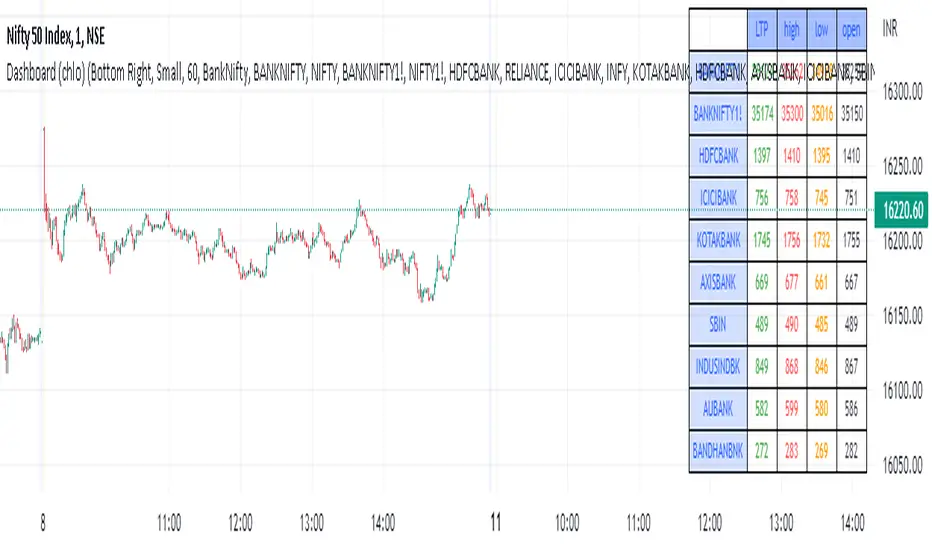
Dashboard (chlo) - v1I am an aircraft maintenance technician who is trying to get into software development in the financial sector.
This is a project in which a dashboard of other security(stocks) with open, close, high, and low will appear.
I could compile this after a detailed study of different dashboards and pine script for several hours
hope you like this.
Cipher Twister - Long and ShortINTRO / NOTES:
This script is based on Market Cipher B Oscillator by Falcon
The difference in this script is that only the useful points are printed on the indicator, namely Long and Short Trade Execution signals to be used by a bot, namely the PT Bot.
The script also differs from the original that it has been upgraded to Pinescript v4
This oscillator can be used with ALL time frames, but generally works the best on 15 minute and 1 hour charts on ANY market, no matter, stock, forex, crypto, spot, futures, derivatives, Nasdaq etc...
DEFINITIONS:
This oscillator forms the foundation of Buy and Exit of Long and Short Trades.
There are 2 'Red' Lines at the top of the channel and 2 Green Lines at the bottom of the channel.
These two channels are set at default to be +53 / -53 and +60 / -60 respectively. These two lines will serve as the threshold point if one is to make cautious trades only.
There is a center line which divides the Oscillator into two parts. Above the center line, the market is in over bought territory and Below the center line is in over sold territory.
'Red' dots are drawn by the indicator to represent a potential Short (or a signal to exit from a Long position)
'Green' dots are drawn by the indicator to represent a potential Long (or a signal to exit from a Short position)
The 'Red' and 'Green' dots are draw when a Cross between both wt1 & wt2 cross, thus providing a fantastic indication of potential trend reversal and entry/exit of a position.
STRATEGY NOTES:
The strategy to use this indicator with for realistic and proper results would be to use it with an automated Trading Bot such as Profit Trailer (PT-BOT)
You could use this strategy manually, however it would mean you would need to sit in front of the screen all day and night long and activate the trades immediately after the 'red'/'green' dots are drawn. Usually this will result in non-optimal entries and exits as well as loss on various instances when a 'red' and 'green' dot are printed close together (which is usually when the market goes into correction/consolidation) and slow entries/exits will result in a loss rather than a small profit or exit at BE (Break Even)
ACTUAL STRATEGY (For use with automated bot)
To be used in conjunction with Heikin Ashi Candles for added cautionary measures
For LONGs ONLY
--------------------
1/ When 'Green' dot is drawn, ACTIVATE Long Position
(Use 1.5% Risk Management for each trade)
(Use Lot size based on 1.5% risk management and xLeverage (if any))
2/ Make sure bot Opens an SL (Stop Loss) value based on 1.5% Risk Management
3/ When 'Red' dot is drawn, CLOSE Long Position.
*If you want to add extra caution to your trade, only activate the trade if the 'Green' dot is BELOW the 'Green' Markers
*For added caution, use color coded Heikin Ashi candles to 'confirm' Activation and Closing of a trade in the bot configuration
---------------------------------------------------------------------------------------------------
For SHORTs ONLY
--------------------
1/ When 'Red' dot is drawn, ACTIVATE Short Position
(Use 1.5% Risk Management for each trade)
(Use Lot size based on 1.5% risk management and xLeverage (if any))
2/ Make sure bot Opens an SL (Stop Loss) value based on 1.5% Risk Management
3/ When 'Green' dot is drawn, CLOSE Short Position
*If you want to add extra caution to your trade, only activate the trade if the 'Red' dot is Above the Red Markers
*For added caution, use color coded Heikin Ashi candles to 'confirm' Activation and Closing of a trade in the bot configuration
---------------------------------------------------------------------------------------------------
Supplementary Notes:
Make sure that your bot configuration will only activate ONE TRADE when the 'Green'/'Red' dot appears.
Occasionally during high volatility , 'red'/'green' dots will appear intermittently before remaining drawn, thus the oscillator 'redraws' the dots during market movement.
There will be times where occasionally a 'green' dot or a 'red' dot will appear, the trade will be opened, but the trade will fail due to the market manipulation (algorithm/market maker bots/fake volume etc), to wipe out those trading on derivatives and futures markets using leverage. Do not worry about this, no bot can make 100% wins, no strategy will achieve 100% win ratio and one necessarily doesn't need a high win ratio when using strict money management practices with your trading for SL and lot size.
If you use this method, you will see great results, but again I must stress, using this method with a fully automated bot is the only way to achieve proper results.

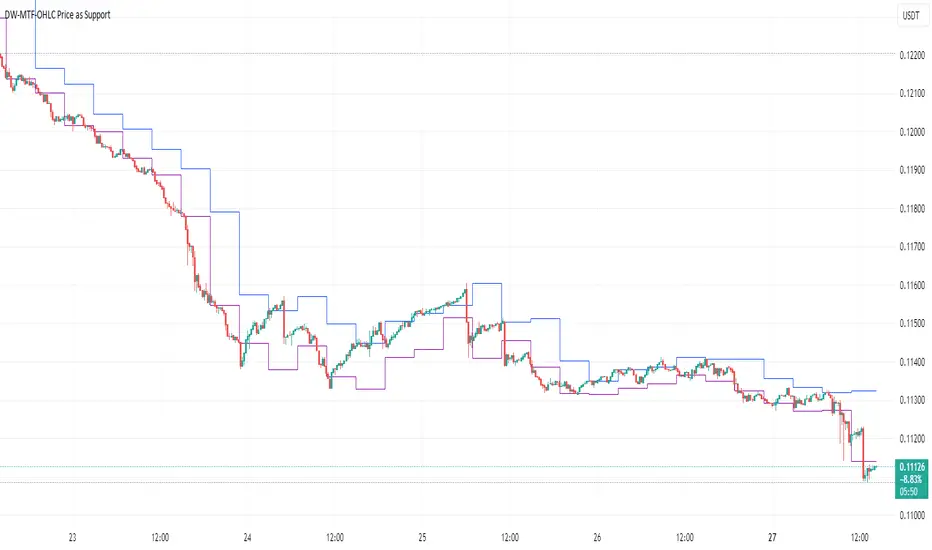
DW-MTF-Close Price(1W/3D) as Support LineThis simple study shows closing price of higher timeframes on your chart. Be sure to use a lower timeframe on your chart itself.
High/Low/Open/Close Daily, Weekly, Monthly Line
I wrote this for the purpose of saving time while marking up charts by automating the process of drawing and labeling lines at areas of interest on larger
timeframes while still having the option to change the style and size of the lines and labels to adjust for any timeframe and avoid a messy chart.
I also used this as an exercise in menu organization giving users every imaginable option and producing clean readable code.
- This indicator draws a line on the Daily, Weekly, and Monthly bar at the High, Low, Open and Close of each bar as price
tends to react when revisiting these areas.
- Each set of bars has an optional identifying label with its own color set that can be shown with or without the lines
price value, and has drop down menus for size and style of each set of labels.
- Each set of lines has inputs for line/text color, line width and style, and can be hidden if the user doesn't have the need for any particular timeframe.
- Lines and Labels with delete when a new line is created.
- I recommend going into Chart Settings/Status Line and turning off indicator arguments OR moving the script to the top
of the indicator list to avoid an obstructed chart view with this indicators arguments. When Pine allows, I will update it to hide them.
Contains some public domain code from T.V. manuals and tutorial for creating drop down input menus for options.
/ ~For My Pal Jittery~
~ Who likes his clean chart and custom colors~
